That was quick, wasn’t it?
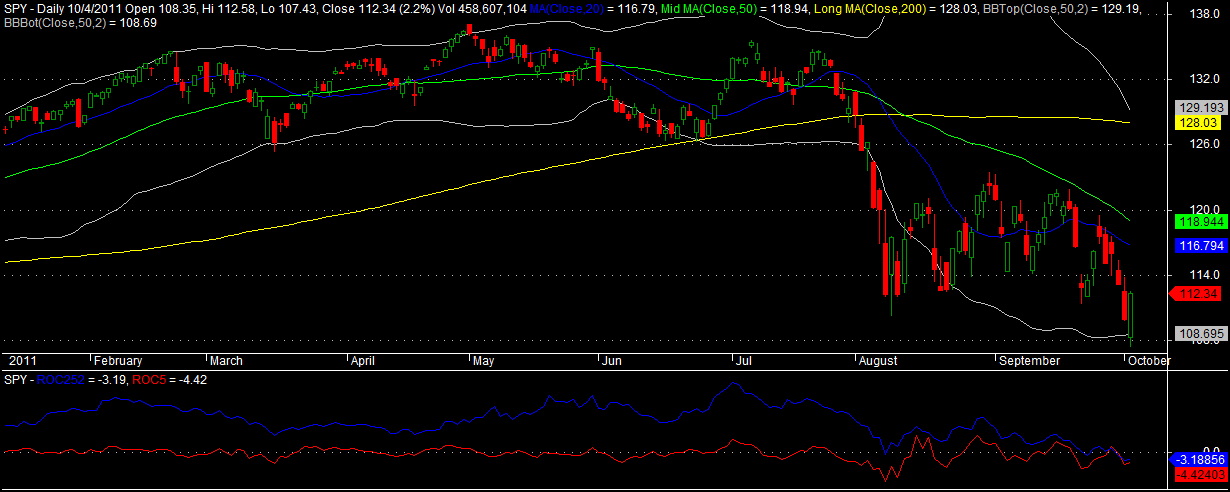
As of Tuesday’s close, the ROC5 was at -4.42 and the ROC252 was at -3.19. On Monday’s close, the ROC5 was also below the ROC252. This means that the short signal has been satisfied and now the indicator is saying to go long.
I believe some whipsaw is normal when the indicator starts crossing. If the market rallies further here, it may cross again, indicating another short.
Keep in mind this is a long-term indicator. While this last short was profitable, it is not designed to catch short-term swings. Instead, it wants to catch long trends. Soon enough, it will settle onto one side or another.
Here is the original post on this indicator: Simple, Long-Term Indicator Near to Giving Short Signal.


nice work,
keep posting the ROC and nuances. I prefer having some core in the long term and am tired of getting whipped sawed
Was trying to duplicate your results and found something interesting. Yahoo claims the ROC5 as of Tuesday’s close is either -2.8 or 2.8, depending on where you look. Well, this is annoying, as well as wrong. Did a little more checking and also found Investopedia has two ROC formulas; both have errors. StockCharts equation is correct.
My Excel spreadsheet agrees exactly with your numbers as expected.
We the R-O-C and we don’t stop.
ROC boys in the building tonight!
I should add MarketSci shows the Sharpe Ratio for your indicator is 0.63, considerably higher than a buy-and-hold strategy. Pretty good for such an easy to follow system.
Strong work, Woodshedder.
Please keep this up. Thanks
Thanks Wood. I really appreciate the work. It’s one less thing I need to try to get done during the day.
Hi guys. Hope you could visit my blog: http://openbooktrader.wordpress.com
Cheers!
It looks like another short will be triggered at the close today – regardless of where the market ends up.