I’m just starting to explore the possibilities of this Caveman system.
It is very simple, and I like simple. I’m not sure where any of this will lead. For now, I’m just exploring and having fun.
To create the chart below, I ran an optimization using brute force where I tested a minimum number of days to hold each trade against a moving average length.
The system simply ranks the stocks by the number of days they have traded above an X day moving average and holds each trade for Y days before re-ranking and possibly rotating into another stock. There are a maximum of 3 stocks held at one time. If, after the minimum hold time, a stock is no longer in the top 3, it is replaced with the higher-ranked stock. The system goes to cash if the $SPX is beneath its 50 day average and the minimum hold times have been met.
This is simply a proof-of-concept, so no commissions or slippage have been included. Neither has a return on cash. I ran the optimization from 1.1.2007 to 1.1.2010. The Russell 2K data I’m using has been adjusted to included non-surviving stocks.
Click on any of the charts to enlarge…
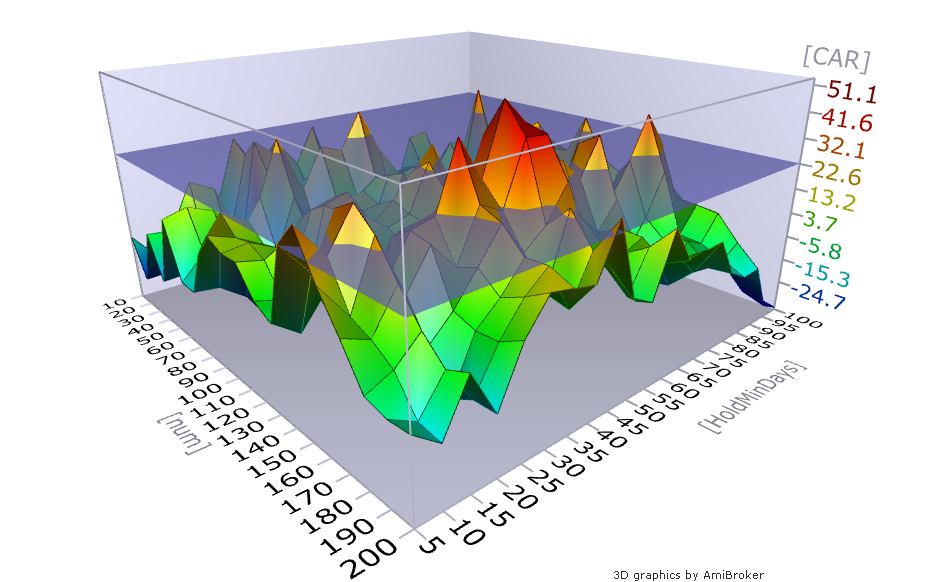
This shows the optimization results of the X day moving average (num) against the Y days held (HoldMindDays). While the optimized parameters achieved an annualized return of 51.1%, the space is not at all smooth. All those sharp peaks mean there is a substantial likelihood that the system will be curve-fit and will never produce anywhere near 51.1%. More likely, we could expect less than half that in real-time. Although since I only ran through 1.1.2010, we will eventually see how the optimized parameter do in out-of-sample testing.
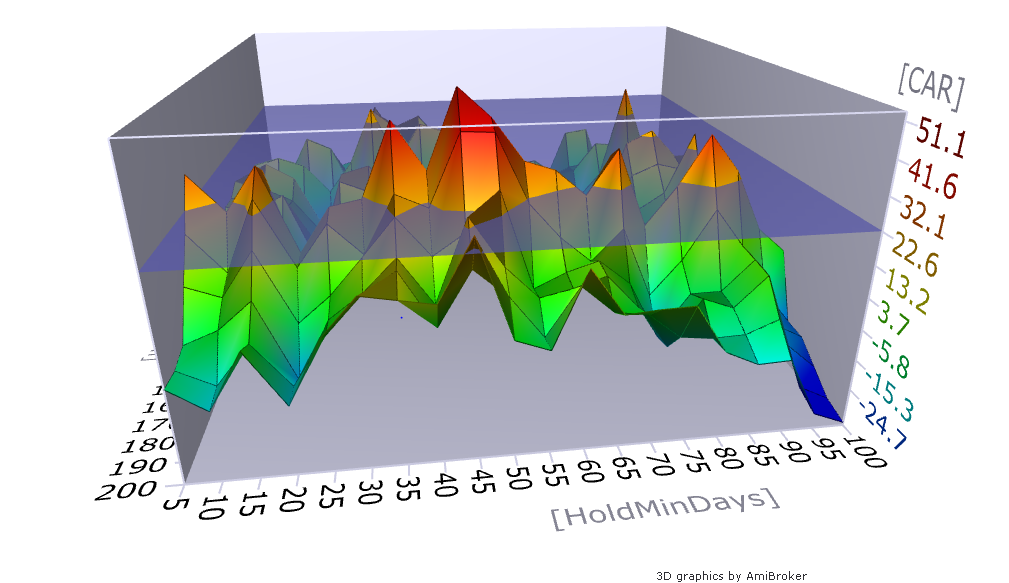
This graph shows a fairly wide space where holding anywhere between 30 and 70 days has been optimal.
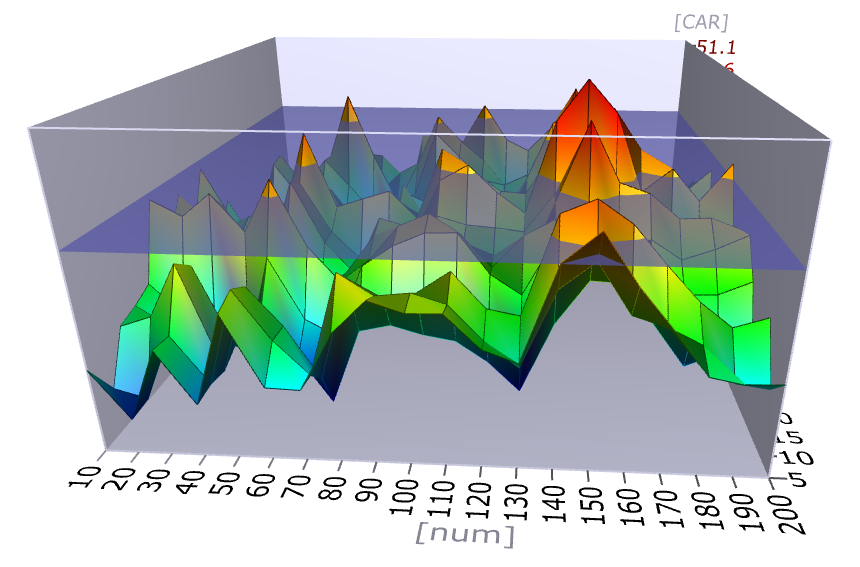
The other side of the 3D optimization graph shows that the optimal moving average was the 150 day. We also see peaks around 100 and 50. I again want to emphasize how “peaky” these results are. We hope that these graphs produce smooth, rolling hills rather than sharp peaks and deep valleys.
So for fun, lets use a 50 day minimum hold with the 150 day moving average.
Results:
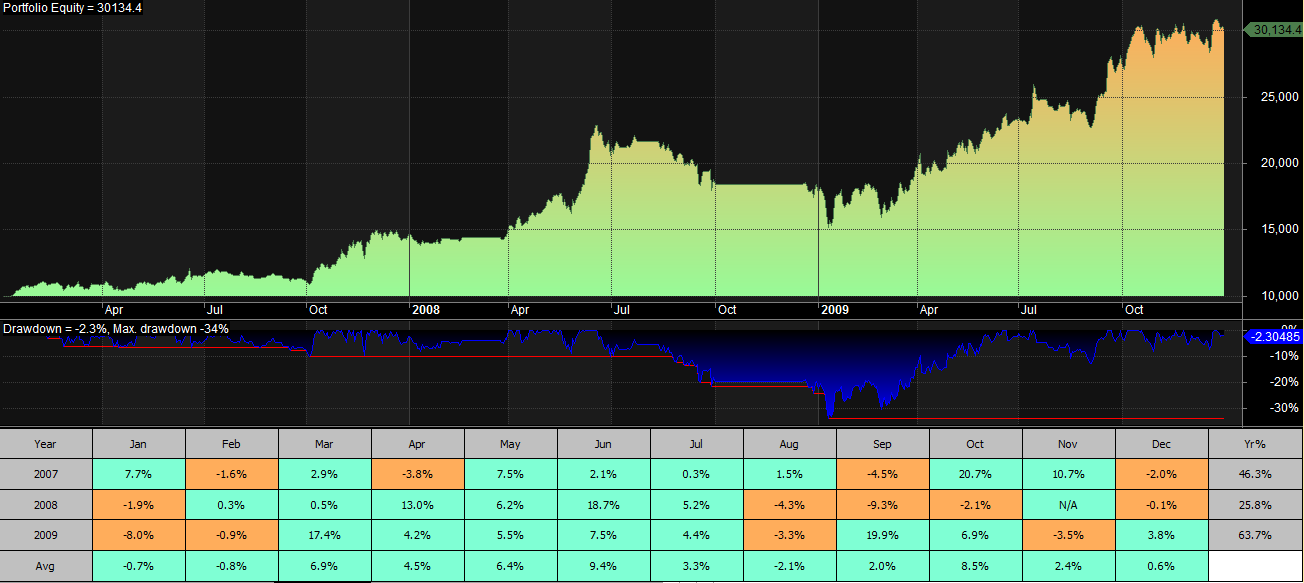
The system’s compound annual return was 44.54% with a maximum drawdown of -33.83%. It made 53 trades with 66.04% winners and an average trade of 7.05%.
The flat spots of the curve are when the system is holding cash.
While this is a fun exercise, based on the very peaky optimization graph, I’m not so sure there is anyway to trade this system and have any faith that it will continue to perform well in the future. That being said, I’m going to play around with it a little bit more.


That’s a very interesting system. Great results.
One concern I would have is some of the winning stocks are illiquid with large bid/ask spreads. Is there any way to find out which stocks were bought and sold during the test? But even with some limitations this is really excellent for a simple system.
I didn’t closely examine the trade list but it is very easy to do so. I still think it will be unlikely to continue outperforming when using stocks. Funds I think are a different story.
Very similar but I’d love to see a test of holding the top X number of stocks based on the avg of their previous 1/3/6/12 month returns. Filters could be a minimum avg volume, positive performance in the lookback period, above a certain moving avg, etc etc. This should pick up the stocks that have been in an uptrend for both the short, medium and long term. Rebalanced monthly on the last day of the month.
Aaron, I think with some google searching you will find several tests/studies that are similar to that.
Good Morning. Do you still offer premium service of deeply oversold stock picked on a daily basis? Thanks for any help
Hi Frank,
No sir, I do not.
Any ideas for a replacement?
Look at Connor’s RSI3 stuff on Trading Markets. It is very interesting.
Is there a list of stocks above their 50 day sma and length of time above it?
I was thinking using etfs rather than individual stocks.
I could generate one, but I don’t think there is one readily available on the internet. I think ETFs are a good idea. I’m going to work on that. I just haven’t decided which ETFs to include.
The ETFs I use are the sector specific (XLU, XLP, etc,) the country specific (EWA, EWC, etc), GLD, SLV, MOO, VNQ, and I feel like I am missing a couple of other things.
Also a side note, I notice that Mebane Faber actual uses a 10 Year Treasury ETF TOTAL RETURN Index in his back tests instead of using the ETF. According to the footnote, he gets that data from Global Financial Data. The chart of that Total Return Index is quite different than anything Norgate uses. I know bond indexes are something you have discussed added in your work even just in-lieu of cash. Ever heard of Global Financial Data? I cannot tell if there is even a plug-in for Amibroker.
Best wishes to you Wood!
Edit: The first sentence of the second paragraph should read as follows: Also a side note, I notice that Mebane Faber actual uses a 10 Year Treasury TOTAL RETURN Index in his back tests instead of using the ETF.
Hi Red, good to hear from you.
Norgate does have some total return indexes available to test over. It was not until recently that I started to look for them, so I’m not sure exactly which ones exist. There is definitely an S&P500 total return index within Norgate.
Hi Wood, what are your future plans with the “sell in may” study? Thanks! How’s the new dog doing?