The breadth indicators that I use are near critical thresholds.
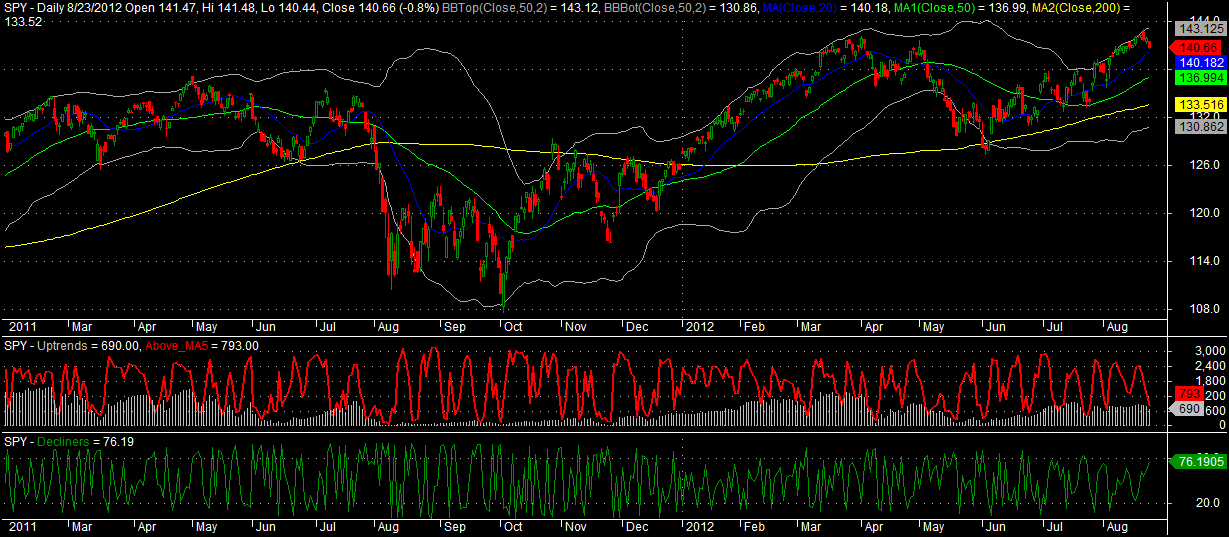
The red line is the number of stocks trading above their 5 day moving averages. Ideally this number would be less than 600. It closed this evening at 793.I use this indicator to signal a swing bounce, one that may last several days to a week.
The green line is a percent-rank calculation of the number of declining stocks. Ideally this number would be greater than 80. It closed tonight at 76. I use this indicator to signal how soon the bounce might occur. It can oscillate very quickly.
Should the market close lower tomorrow, it is likely that both of these indicator will be aligned. If so, I will expect the bounce to occur soon, as in a day or two, and I will be looking for the bounce to last for several days. Buying a lower close tomorrow may make a great swing trade.
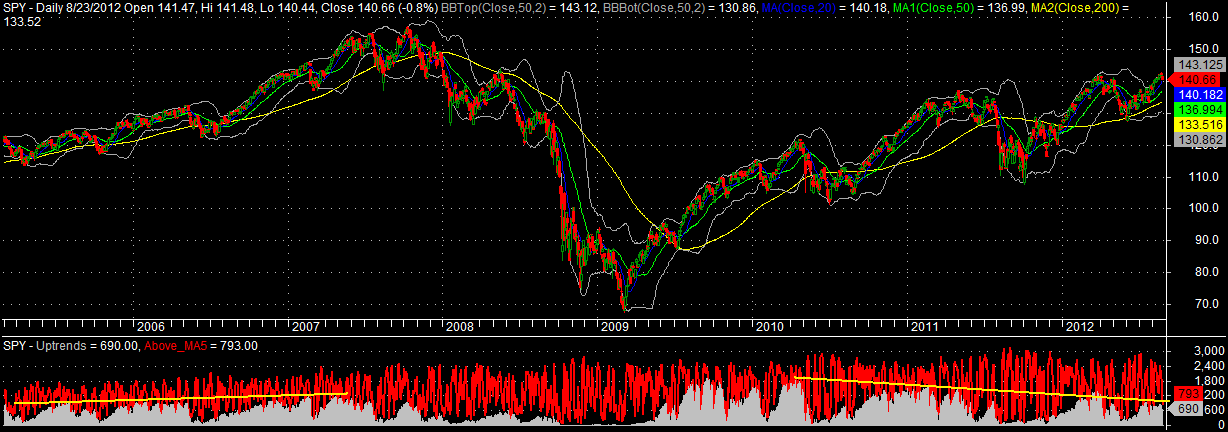
A word of caution: Note the gray histogram in the middle pane. This is a proprietary measure of the number of stocks in an uptrend. It is slowly going lower and lower even though the market is going higher and higher. This pattern has been in play since the bottom in 2009. This is a bearish divergence and should not be ignored. Eventually, if there are not enough stocks in an uptrend, the market advance can not be sustained and a serious correction of -10% or more may occur. These divergences can last for a long time, so this is not something that can be prepared for tomorrow.
I have included a longer-term view below and have hand-drawn a trendline to illustrate the divergence.


I think maybe we get a lower low in the afternoon and close higher tomorrow. So many contingency plans to make.
Either way I think you nibble at the weakness.
Great stuff Mr. WS!
Thanks BRA!
These indicators are right up my alley, thanks for posting the updates.
Thank you! Can you tell me from whre I can get those data?
regards