Two breadth indicators are at levels which suggest a bounce is near.
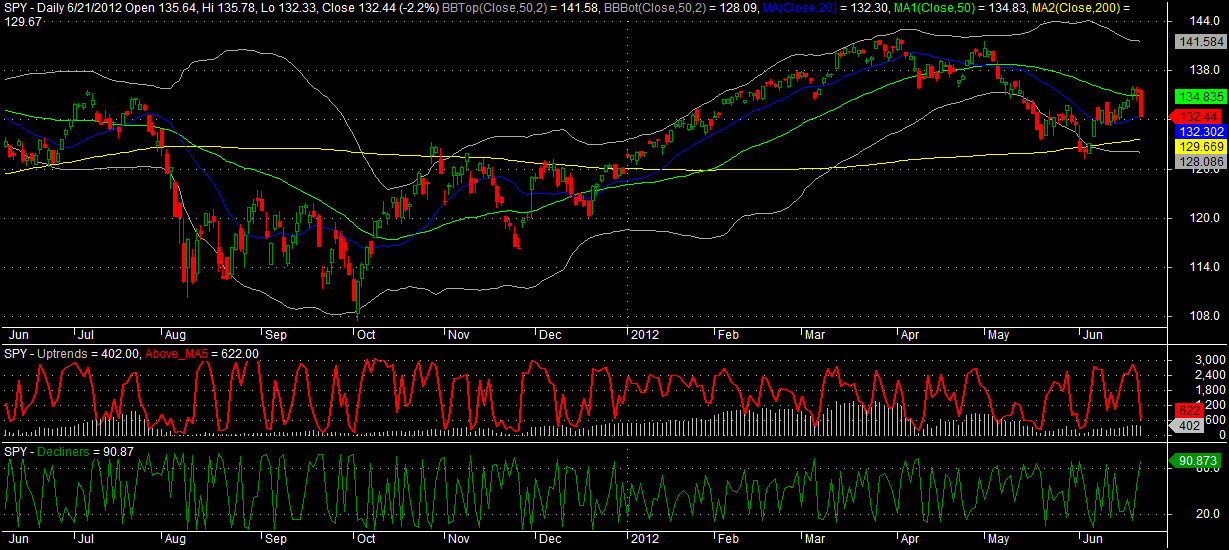
The middle pane, red line, is the number of stocks trading above their 5 day moving averages. At this level, this indicator is suggesting that a two to three day bounce may develop.
The lower pane, green line, is a measure of the number of stocks that declined. It is nearing extreme territory. When it gets to these levels, it usually means a bounce, or at least some stability, is imminent. However, this signal can be taken off the board by only one day’s worth of stability.
Based on these two indicators, what I am seeing is that a bounce is near, and it may last for as many as three days.
This post was written before the market opened to be published at 11:00 a.m.


Wood, do you or is is possible with the setup you have, to put probabilities around the indicator triggers?
Yes. I have done it many times. I would run another tonight but we are starting vacation. If you want to look, just look under the “Market Breadth” category. You’ll find some results there.