What makes a good breakout? I aim to find out…
It seems that everyone loves breakouts. Perhaps it is because of IBD or the Turtle Traders. Or maybe it is because it is easier to buy a stock that is going up, rather than one that is going down. Whatever the reason, breakouts are consistently featured across a wide range of stock trading outlets on the internet, on the TV, and in the print media.
But do they work? And if they do work, do some work better than others?
Let’s start simple…
The breakout, in the most simplest of forms, is a stock that makes a new high. A simple breakout system can be one that buys stocks making a new N-day high, and holds them for X number of bars. Since I believe that simple systems are generally more robust than complex systems, this simple breakout system is what I will start testing.
The Rules:
- Buy the next open after a stock has closed at a new N-day high
- Hold the stock for X days, selling at the close
- System can hold a maximum of 20 stocks
- If there are more stocks than cash, the system ranks picks by dividing volume by the 50 day average volume. Highest ranked stocks are purchased until the system runs out of cash
- Only stocks with a close > $5.00/share and 10 day average volume > 300,000 are eligible. No OTCBB.
- Delisted data was used (no survivorship bias)
- Test period is from 1.1.2001 to 1.1.2009
Let’s look at the results of the optimization:
In this first test, I tested N day highs of 10 – 50 in increments of 10 against an X bar exit of 0 – 50 bars in increments of 5 bars.
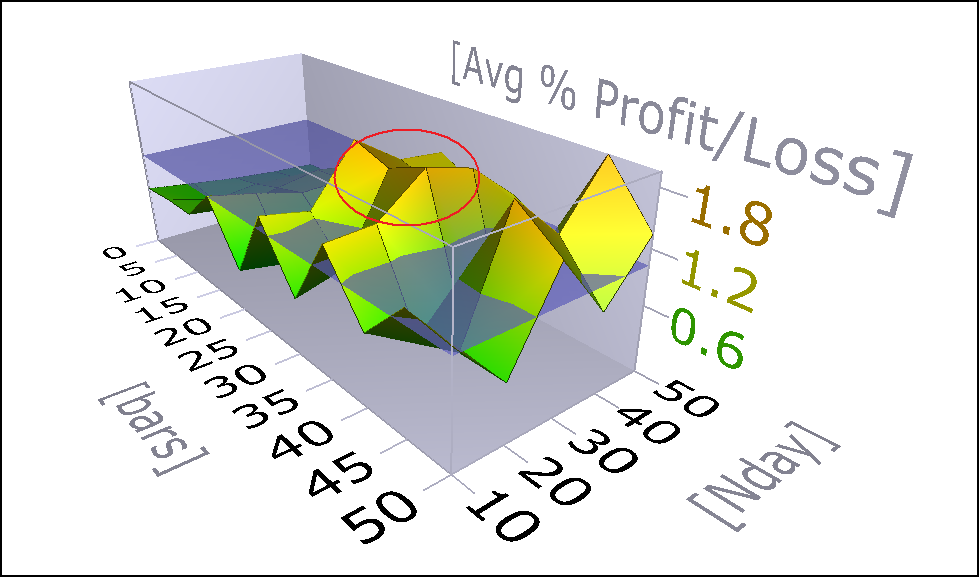
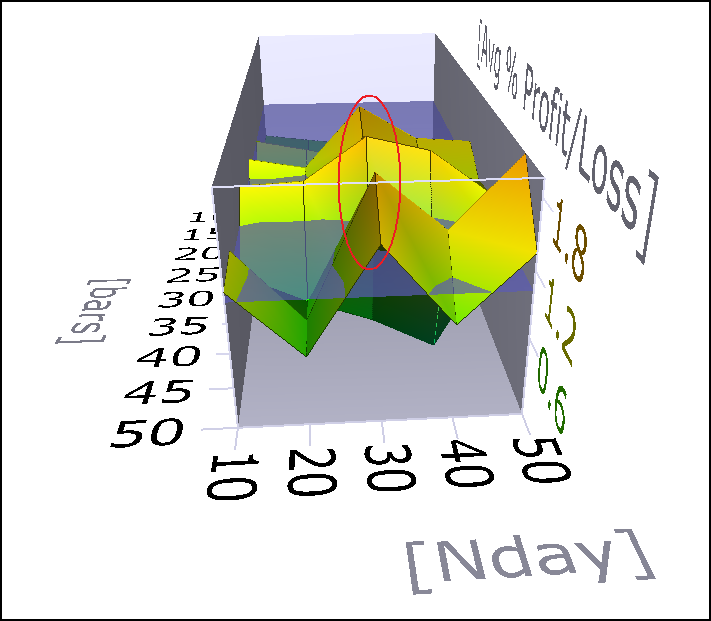
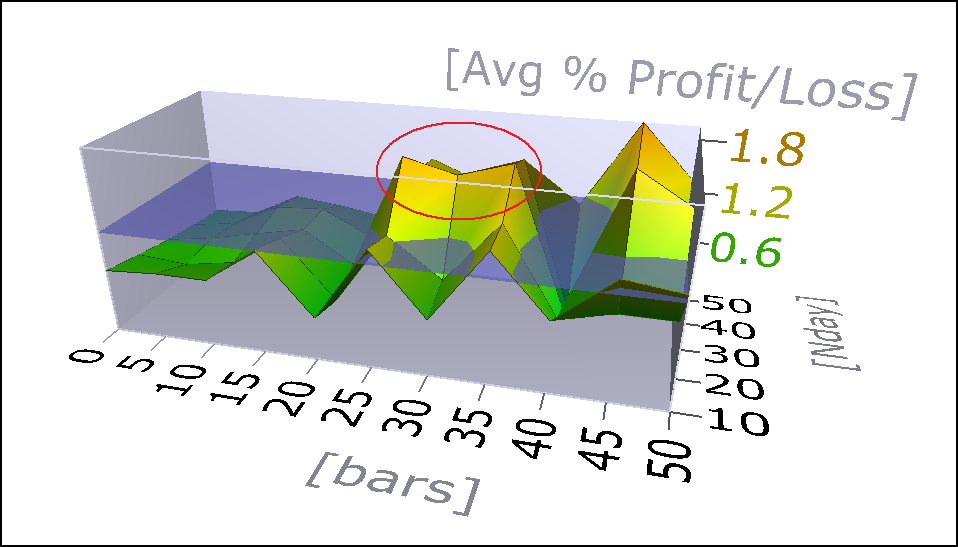
Observations:
I circled the areas we want to focus on. It appears that a breakout making a new 30 day high and using a 30 day exit might show some promise. However, the blue water line is at approximately 1%. This means that on average, these trades are making ~1.5% after being held for 30 trading days. Really, this is not very good. To contrast, PDS average trades are better than 1% with trades being held on average for only 5 trading days.
There is a ton of work to do here. The next optimization run will test breakouts of a 50 – 100 day high against an exit of 50 – 100 days.
Also, the ranking mechanism will have to be tested. As I posted here, there are a variety of ways to rank breakouts. Beyond ranking, there are stops, position-sizing, etc. and even more to be considered, and that is only for a simple breakout making a new N day high. Imagine the complexity if we start looking at breakouts from certain patterns…
For now, I will attempt to establish baseline variables for a simple breakout system.
Bonus:
Here is the equity curve generated from the system using a 30 / 30 setup: Buy stocks making a new 30 day high and sell after holding 30 trading days.
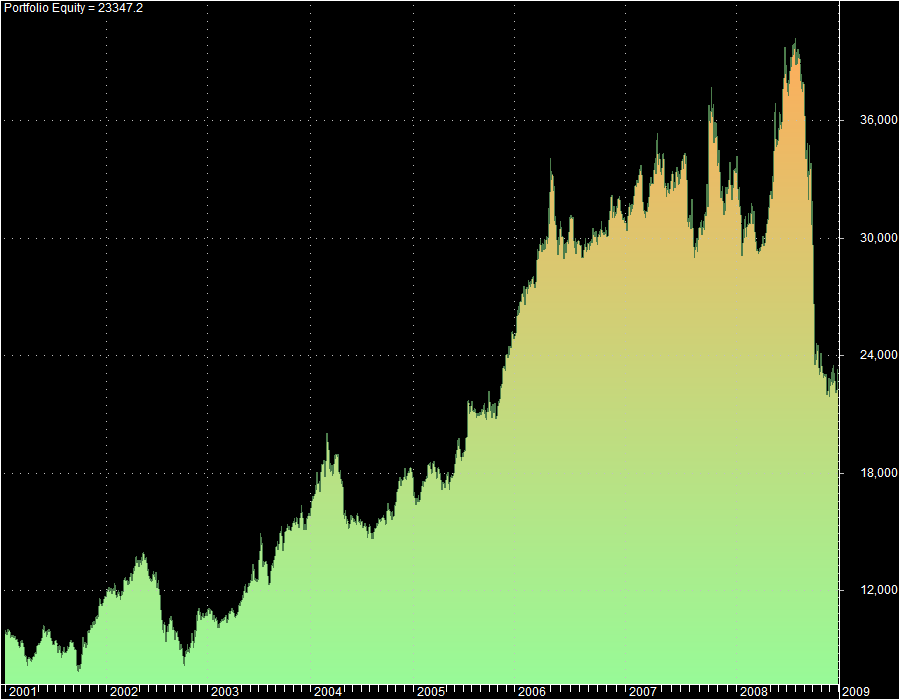
Based on this equity curve, a moving average filter will eventually be employed in an attempt to reduce that huge drawdown. Results above resulted in a compound annual return of 11.17%.
I use AmiBroker to generate most of the charts and graphs that I use and Norgate Premium Data for my delisted and end-of-day data.


this is awesome
I’ve had some success with breakouts and others times they fail miserably
thanks for your hard work. i’ll be reading the next part
this is awesome
I’ve had some success with breakouts and others times they fail miserably
thanks for your hard work. i’ll be reading the next part.
Glad you like it Luke. It is helpful for me too. Although I trade mean-reversion, I’ve always wanted a good breakout system.
The problem is that breakouts may have become so popular that the edge has been worn away. We’ll see…
Breakouts still work but only on select stocks.
The key is properly screening for trending stocks before you use a breakout strategy.
That is my opinion, anyway.
Aly, would you mind sharing how you quantity a trending stock? I can test that idea.
Try a measure of momentum. For example, c – c[75] > 0. Only take stocks with positive momentum.
I am fundamentally wired to hate buying stocks that are going up so I rarely do. I leave that to more talented peepslike the 12631 gang.
Your posts are the shizz man
Thanks Check! I am better buying falling stocks too…
Great and interesting post, Wood.
One of the issues here is how to discern a breakout v a normal range expansion. There are a ton of stocks which trade in fairly narrow bands – and then there are those which get out and run like crazy – how to tell the difference seems like it might be key.
Have you tried something like filtering by ATR at all? That is, buy only when a stock breaks out by a certain percentage/amount above the old highs/closes – or closes at that level? That would filter out the range bound and spikers – by and large – while keeping you in view of the serious runners. Something like 30d high + 1/2 ATR or the like.
I use a 9 bar breakout from time to time – I find an effective initial stop need only be two days back – if the breakout is going to work, it’ll work – and if it swings sideways, you get out fairly soon. (Why 9 days? B/c added to today, that’s two weeks of trading – ’bout the memory length of most traders…)
Wood,
Great stuff as usual! As a die-hard mean reversion trader it’s always interesting to see contrasting approaches. I’ve just never been able to come up with a good one. I’ve tried different rotational systems, momentum, breakout, etc. but nothing beats good ole’ mean reversion. That being said, I’m interested to see your observations. I’ve thought for a long time that these systems should be used together. In these trending bull markets we don’t get many trades, so this is a nice complement.
One possible idea for filters, along with the idea of momentum (mentioned above) and your moving average idea, would also be to look at market conditions. In other words, maybe it’s better to take these trades (or a more aggressive position size) during trending bull markets. I use a simple filter like this for some of my systems. I have a post on one approach to identifying these markets at the link below, but I’ve read enough of your posts that I know you likely have several others.
http://snaptrader.blogspot.com/2011/03/bear-market-strategy-part-2.html
Good Thinking,
Bill (SnapTrader)
Bill, I love the idea of more aggressive position sizing during ideal market conditions. I know that works well for mean reversion. Thanks for the link, and AWESOME results on Covestor!
I do agree, and this is sort of what I’m after, that it would be great to pair an MR system with a breakout system.
Wood,
Thanks for taking the time to post shit like this…very intersting.
Thanks Wood. I had a sucky (technical term) trade in my Covestor model yesterday. I was #1 for the MTD results, and now I’m not even on the top performers chart. Oh well, just a reminder that we’re all just one stinky trade away from misery. I’ll still have a profit for the month, but not quite where I was… ugh!
If you are going to test breakouts then why not test real breakouts and not the “day after breakout”? Real breakout traders buy the moment a stock breaks out, not the day after and the don’t have a set time frame as to when to exit the trade. If someone were testing the Power Dip strategy and decided to buy the day after the Power Dip said to buy, would you consider that a legitimate testing strategy?
Also if you look at the breakout equity curve, you see that the system you tested returned about 200% during a time period when the overall market returned 0%. You call that “not very good”? Why don’t you backtest the Power Dip system over the same time period and report the results? You have reported 2 years of results for the Power Dip system during one of the biggest dip/recoveries in the history of the markets and then you extrapolate those results back 20 years “hypothetically”. You really think that is legitimate testing?
The bottom line is that dip buying and mean reversion don’t work over the long run because markets are not random. The stock market represents companies, companies are groups of people, traders are people, people are not random. Are you random?
Sage, with all due respect, you have made quite a few errors in your comment, and they need to be corrected.
1. I think there are a lot of traders who follow IBD and William O’Neil who would disagree with your assertion that “real breakout traders buy the moment a stock breaks out, not the day after…” Also, without a quantifiable exit strategy, most traders will never profit from trading breakouts. The exit strategy is really the ONLY thing that matters when trading breakouts.
2. The Power Dip DOES buy the next day after the buy signal is triggered.
3. After figuring in commissions, the breakout strategy presented here (you do realize that this is only the_very_first_step in developing a breakout system, right?) will not do much better than the market has done, on average. If you think it is fantastic, then you should be thanking me for publishing it here for you to trade, for free.
4. The Power Dip system results over the same time period are easily accessible. Your statement that I have only reported 2 years of results for the Power Dip system and then extrapolated those results back 20 years hypothetically is patently false. Had you made one click on the PDS 2.0 link, you would have landed on this page, which shows backtest results for 20 years. And these results are not extrapolated. They include delisted stocks and they include .01/share for commissions. http://st.ibankcoin.com/membership_benefits/automated_trading_strategy.php
Furthermore, on the Power Dip system site, there are more than five different sets of statistics, equity curves, drawdowns, and historical, year by year, month by month, results for the Power Dip and they go back 10 years. Again, access to this is free and is certainly not in any way secret.
For comparison, I ran a test of the Power Dip 20% equity per trade model, with commissions included, during the same time period covered in the breakout backtests- 1.1.2001-1.1.2009. It has a compound annual rate of 74.26%, with an average trade of 1.94%, and an average hold time of 6 days. I will be happy to email you the trade log, equity curve, and any stats you desire so you can see for yourself the trades that were made.
5. Your last paragraph states, “dip buying and mean reversion don’t work over the long run because markets are not random”. You are right that markets are not random, and that is precisely why mean reversion has worked so well. If markets were truly random, mean reversion would not work. Nor would buying breakouts.
Fair enough. I misread the backtesting dates. But on the breakout system did you use the same money mangement technique (risk 1% of equity per trade, etc) as you did with the Power Dip System? There was no mention of money management. Im not saying breakout traders have no exit strategy, typically they follow the breakout up with a trailing stop and just ride it as long as it goes. I still don’t think it’s a fair comparison because you aren’t using any sort of stop loss on the breakout system. No serious trader trades like that, the Power Dip system has a stop loss. During the time period you chose, the overall markets were actually down about 30%-40% (not 0% as I mentioned earlier) , so of course a system with no stop loss would do worse than a system with a stop loss in that environment. I realize this is just a first pass of your testing, but there are some things that could be done to make it a more fair comparison.
Sage, it used a similar money mgmt. technique, 20 positions, with equity allocated equally among all. Since there was no stop used, one cannot assign a risk per trade.
There are many, many ways to trade breakouts and there are many ways to exit. I’m sure a trailing stop will be something that I test.
The initial tests will of course not use any sort of stop. The initial tests set the baseline so that we can determine the effect of the new variable; in the case you are speaking, the new variable would be adding stops. We must establish a baseline of one sort or another before we start adding variables.
The Power Dip 2.0 does not use a stop. Almost without exception, systems will do worse with stops, no matter what the market is doing. There are not many systems that I’ve ever tested that improve with typical risk mgmt. stops. A stop that functions as a market timer stop, such as exit all long positions when the SPY falls beneath the 200 day moving average can improve things.
The intent of the article was in no way to compare a breakout system to a mean reversion system (The Power Dip). They are completely different.
Stay tuned. I’ll have more breakout stuff posted soon.