Continuing the quest to develop a decent breakout system…
Be sure to read Part 1 for the introductory information. Part 2 (this article) will jump right into things with no background information.
The Rules:
- Buy the next open after a stock has closed at a new N-day high
- Hold the stock for X days, selling at the close
- System can hold a maximum of 20 stocks with capital allocated equally among all
- If there are more stocks than cash, the system ranks picks by dividing volume by the 50 day average volume. Highest ranked stocks are purchased until the system runs out of cash
- Only stocks with a close > $5.00/share and 10 day average volume > 300,000 are eligible. No OTCBB.
- Delisted data was used (no survivorship bias)
- Test period is from 1.1.2001 to 1.1.2009
Let’s look at the results of the optimization:
In this second test, I tested N day highs of 50 -100 in increments of 5 against an X bar exit of 50-100 bars in increments of 5 bars.
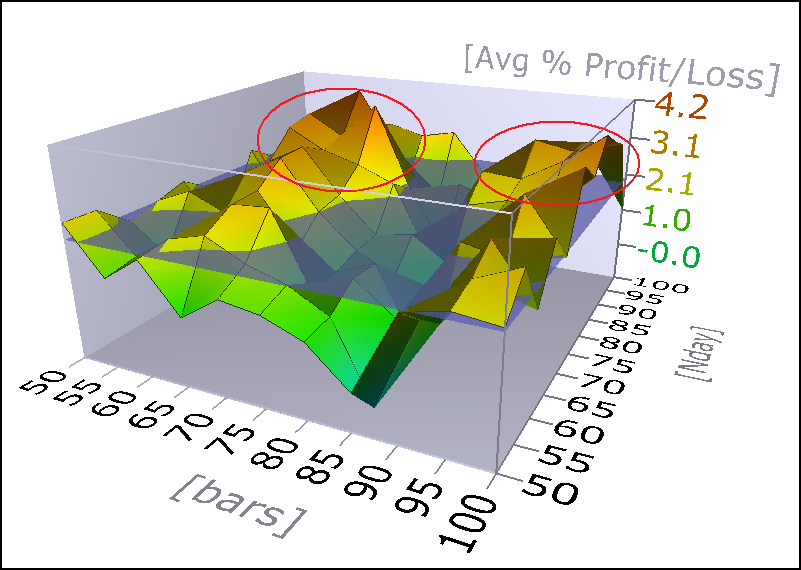
The graph above shows that there are two areas which show promise. The only problem is that the area on the right hand side requires holding the trades almost twice as long as they are held on the left hand side to achieve similar gains. However, the right hand side, representing buying a stock after making a new 90 day high and holding it for more than 95 days appears to be less peaky and therefore more robust.

The graph above shows that the greater the N day high, the greater the potential average trade. I suspect the trade off here is to find a balance between opportunity and potential profit. It is likely that the greater the N day high, the fewer the number of stocks (less opportunity) meeting that criteria. If there is not enough opportunity, the system may not be fully invested, and this will hurt performance.
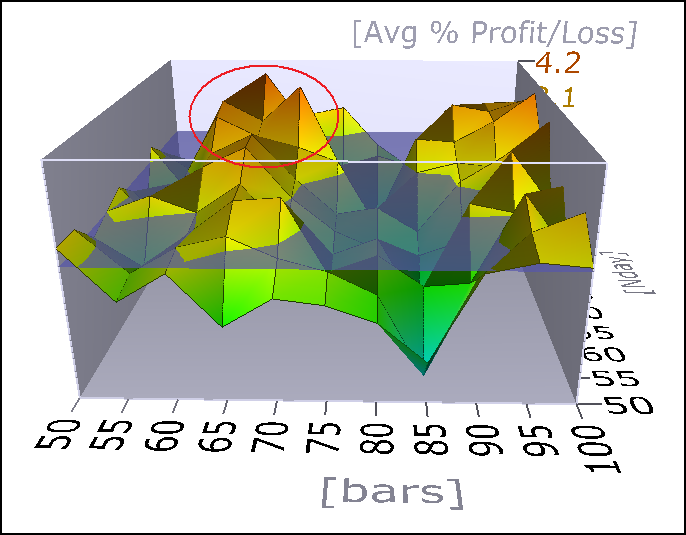 Note the circled area in the graph above. It is not very smooth, while the raised area to the right that corresponds with 85 bars or better, is more rounded and less peaky. It is likely that holding for greater than 85 days will result in more robust and consistent results.
The Importance of Profit/Bar
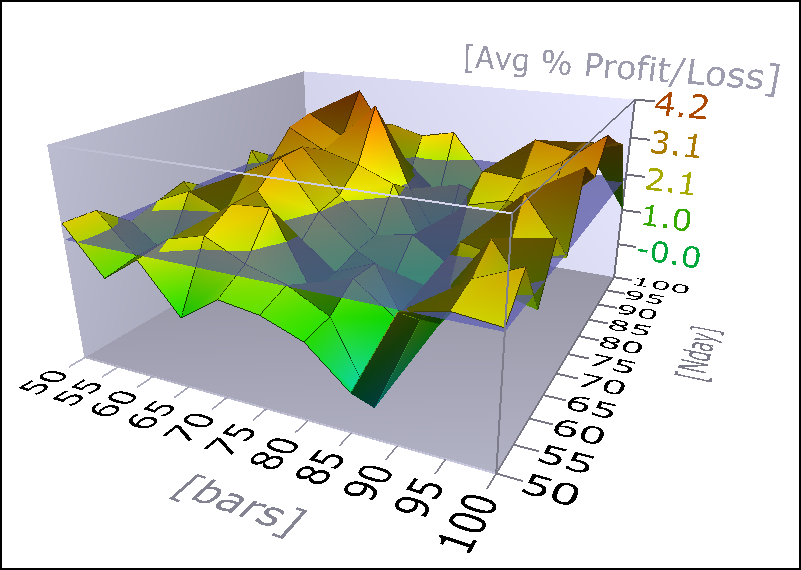
The above graphs show that holding trades longer may result in similar but possibly more robust results in real-time than holding them for a shorter amount of time. In order to accurately compare results, we want to divide the average trade by the number of bars the trade was held.
For example, if we use what looks to be the optimum settings (based on the above graphs) of an N day high of 90 and a hold of 65 bars, the average trade is 4.15%. We then divide that by 65 to get 0.063% of profit per day.
Using what appears to be the more robust criteria of an N day high of 85 with a hold of 90 bars yields an average trade of 3.08% and a Profit/Bar of 0.0342%.
Next Up- Ranking
Next, I will re-run these tests but will try out different ranking methods. I’m curious to see if they make much difference at this early stage of testing.
Bonus
Here is the equity curve generated from these optimized inputs: N day high of 90 and a hold of 65 bars.

This equity curve shows a compound annual return of 15.55%


this is gold. thanks Wood.
the delisted data makes it even sweeter.
it makes sense that buying stocks which are in the top sector ETF (ranked by performance over x-period) might improve results. but I could be wrong
sort of like sector rotation + breakout
Thank you once again for sharing your work. The chili recipe was great! I notice here that volume only plays a part when it comes to a day filled with breakouts and only some can be selected. The key to IBD breakouts and the like are that the breakout day must be on excessive volume versus the 50 day average volume. Big cap stocks at least 40% above average and I think at least 100% for smaller stocks. Have you given thought to a volume filter for the breakouts? Multitudes of investors beating the doors down to buy the stock on the breakout day would bode well for a nice run in the stock, and better the odds of success, you would think?
Dave, it is probably not clear, but these tests are ranking by volume.
Here is how I described it: “If there are more stocks than cash, the system ranks picks by dividing volume by the 50 day average volume. Highest ranked stocks are purchased until the system runs out of cash.”
So it is not required for the volume to be greater than the 50 day average volume, but each pick is ranked based upon the relationship.
For example- 3 picks.
ABC stock 1,000,000 50 day average volume. Volume on breakout day equals 800,000 shares.
XYZ stock 500,000, 50 day average volume. Volume on breakout day equals 1,000,00 shares.
AAA stock 5,000,000 50 day average volume. Volume on breakout day equals 5,250,000 shares.
So here is how they would be ranked:
ABC = 0.8
XYZ = 2
AAA = 1.05
So that if there was room for only 1 new position, XYZ would be chosen. If there was room for 3 new positions, all would be bought, even though two of them didn’t have a surge in volume. In the early stages of testing, I think it is best to make sure the system is taking a lot of trades, to ensure a generous sample size. As we get further into things, we can try improving it by creating more restrictions in the filters.
Whoops, XYZ stock should have had 1,000,000 share volume on breakout day.
Hi. I am also busy with breakout systems for a while now. I like your ranking algorithm. Nevertheless, using a relatively long time-based exit (like 65 days) implements a strong market directional bias in your results which can be easily observed in the equity curve. Therefore, I recommend to use only shorter exits or other exit methods like trailing stops…