Since it has taken me a while to get this series going, here are two articles to refresh the memory:
Indicators and Edges: The Introduction
Indicators and Edges: Baseline Results
In the first Baseline Results post, I asked for a review of my methodology for developing a baseline. I received lots of very good feedback. Most of it can be read in the comments section of the post. I also received a few emails. Let me summarize the salient points:
- Since this will be a database of stocks that will be actively traded, the database should filter stocks for volume and liquidity.
- The database should be split into bullish and bearish periods to allow for more precise comparisons.
- An average 1 day rate-of-change should not be extrapolated out over a period of days.
- Use de-listed data.¹
These suggestions were very helpful, and all were implemented except for using de-listed data.
The Volume and Liquidity Filter
Each stock was filtered to have a 20-day average volume of greater than 100,000 shares.
To filter for liquidity (we want a reasonable bid/ask spread), I multiplied the 20-day average volume by the 20-day average of the closing price. The result must be over $1,000,000.
If at any point in time any stock could not meet the minimum criteria, that period was dropped from the database, and then later data included once the filter was again satisfied.
Bullish and Bearish Markets
One database starts on 1/1/1990 and ends on 12/31/1999. This is my bullish database.
The second database runs from 1/1/2000 to 9/9/2009. Of course, this is the bearish database.
A third database includes all data I had available, from 1985 to the second week of September, 2009.
ROC1, ROC20, and % of Up Days
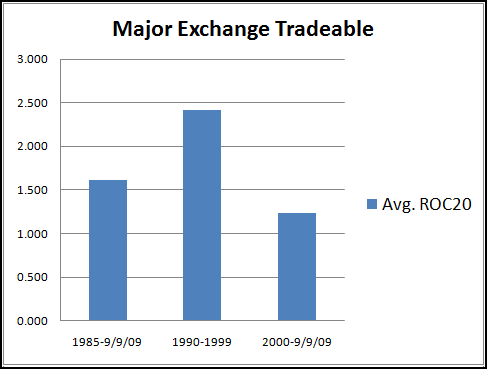
To avoid having to extrapolate a 1-day ROC out over 20 days, I ran more tests to determine the average 20-day ROC for each database. I also calculated the percentage of days that closed up.²
Baseline Data: Major Exchange Tradeable
Just as I during the first round of testing, I excluded all over-the-counter issues and any issue that traded under 1 dollar.


Summary…
It is interesting that the filters did not significantly change the results of the 1985 – 9/9/09 database compared to the original database covering the same time period.
I feel that the baseline results are now robust enough to begin testing indicators against them. I am glad to have this part of the project out of the way so that I can now begin the fun stuff!
Footnotes:
¹ I use Norgate data and can easily purchase their de-listed database. However, I do not have a single strategy that buys cheap or value stocks to hold for any length of time, therefore I would derive little benefit as those would be the bulk of the stocks in the database. However, any stock that was acquired would also be included in the de-listed data, and those might have been ones I would have traded. Long story short, the database is not perfect.
² For a great explanation of why the % of Up Days is low, read Rob Hanna’s excellent post on the topic: A Long Term Look at the Nasdaq Advance/Decline.


Wait, the bear database is from 2000 to 2009? What about 2003 through 2007? Picked for 10 year symmetry?
Damian, c’mon 2003-2007 was nothing but a bear market rally enabled by cheap credit and lax lending regulation. Well, sort of.
10 year symmetry was not much of a concern. The true concern was the amount of time involved in testing, reporting, and writing about multiple periods of time.
Honestly though, if you look at the ROCs, it seems pretty obvious that one period was a lot more bullish than another.