The MACD is one of the best-known indicators, or more precisely, centered oscillators. It is used in a variety of ways by many traders. A popular way of using the MACD is to trade the moving average crossover of MACD above its 9 day EMA. As this setup is so widely popular I’ve often wondered how well it works, partially due to my natural skepticism but also because if it works, perhaps there is a system that can be built using it.
Testing the MACD
Entry: Buy the close if the difference between the 12 and 26 day exponential moving average (MACD) has crossed above its own 9 day EMA.
Exit: A time exit between 1-20 days will be used, with the trades being executed at the close.
How do we know if it works?
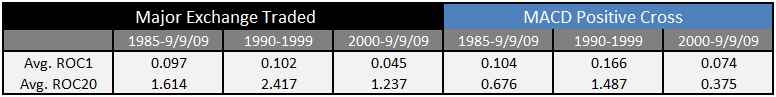
The 1 day and 20 day rate-of-change will be compared with the baseline data. Also, I may work up a simple test with money management rules to see the system drawdown and equity curve.
Some Specifics…
When I backtest ideas, I like to be sure that I am testing them in a way that can be re-created in real-life trading. It bothers me that there can be bullish MACD crosses when the cross barely registers, because if one were trying to recreate this trade in real-time, it would probably be impossible to know for sure if the cross was going to happen in time to get the order filled. Therefore, I calculated the difference between the MACD and Signal and required the result be above a minimum threshold.
Requiring the threshold performs two functions in the testing. The first is that it helps to make it more possible for the trade to be replicated in real life. Secondly, we can evaluate the results to see if they are improved by requiring a strong MACD bullish crossover.
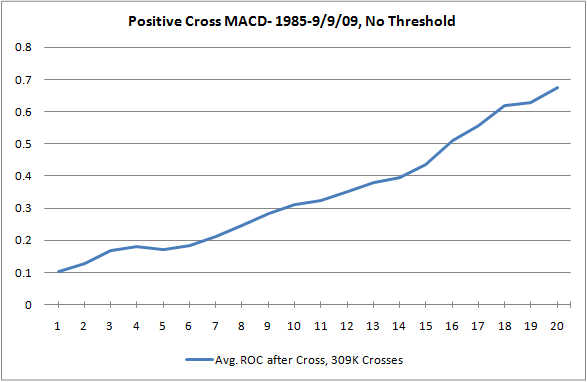
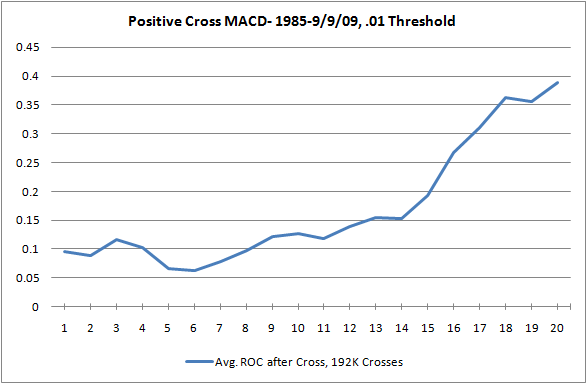
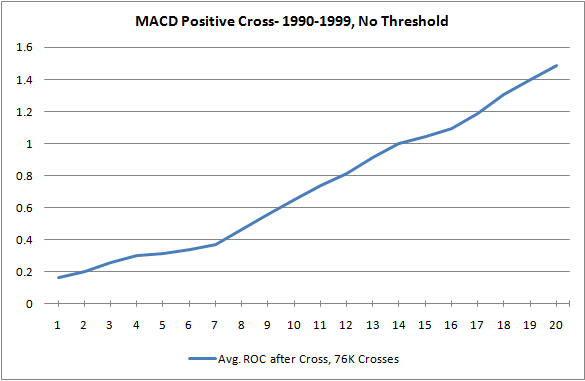
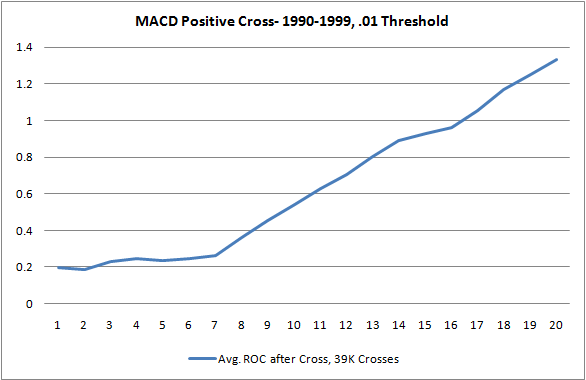
Four separate tests were run. One test did not use a threshold, and the 3 others tested thresholds of .01, .03, and .05 A threshold of .01 is very small, and as represented in the histogram of a typical MACD graph, may even be imperceptible unless the graph is magnified.
The Results
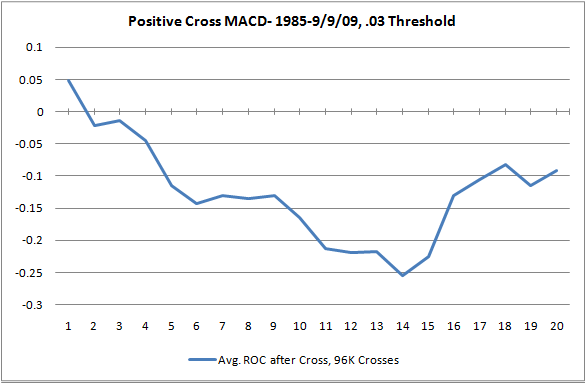
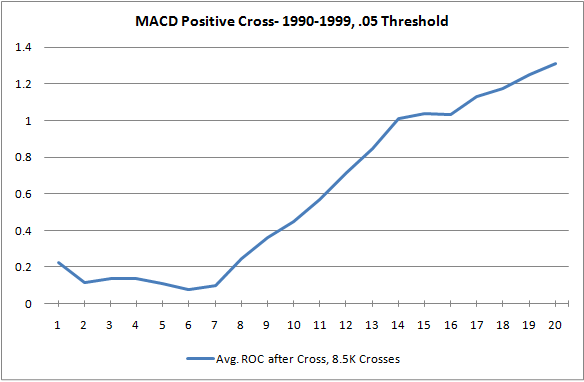
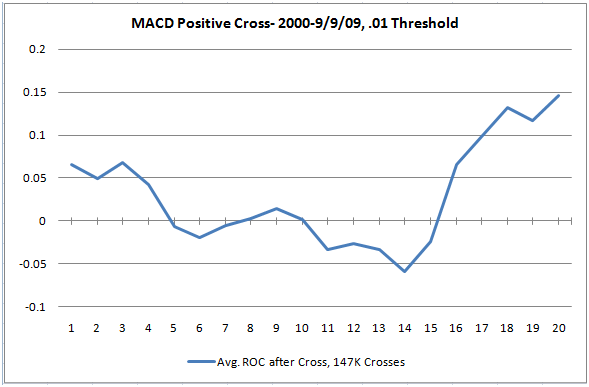
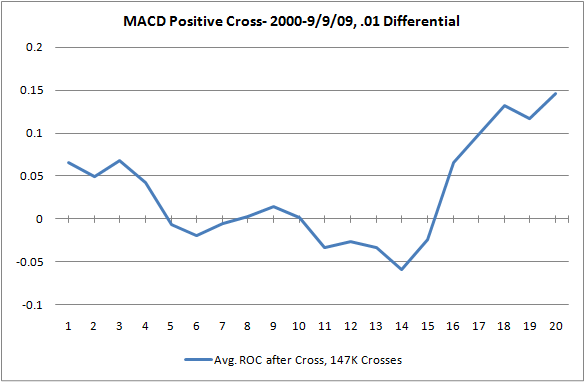
I am also including below 4 graphs, each showing the average ROC, from 1-20 days out, following a positive MACD cross. Pay careful attention to how the threshold criteria affects the ROC.
1985 – 9/09/2009

Results: 1990-1999 (Bullish Period)

Results: 2000 – 9/9/09 (Bearish Period)


Summary:
MACD can provide a slight edge on the day after the cross. Even during the bearish period when a bullish MACD cross did not work well at all, the day after the cross provided almost double the average one-day return.
Adding the threshold requirement puts an interesting twist on the MACD cross, at least in my opinion.
Almost without exception, a strong MACD cross (one that closes with the histogram greater than .05) results in a period of negative, or lowered expectancy.
Over a longer period, as measured by the 20 day rate-of-change, a MACD cross is often much worse than a random entry.
More than anything, these MACD studies show that for the better part of 10 years, the universe of stocks has been subject to a strong tendency to mean-revert. Likely the best way to use the MACD is to filter for a reading that is very extended above/below the zero line, and then short/buy the stock, expecting a reversal to the mean.
Comments, concerns, and criticism on this research is welcome, as always.

I included the above chart to show just how small a cross of .05 is, in comparison to how much it affects future returns.


Good analysis and post Woodshedder!
Thanks Aristotle. There is so much more that I don’ t even have time to write about…
Hi Woodshedder,
I have been playing around with the macd crosses on a 15Min timeframe similar to your post..
Rule: buy/short on a macd cross on next 15 min bar open after the cross happens.
Gap rule: Use 15 minute rule on gaps for positions held overnite
It seems to work better in volatile markets then trending markets. Also, opening gaps seem to cause havoc holding a position overnite.
Do you have any way of seeing if this approach is profitable? Do you have any suggestions about adding other indicators to the mix to make it more proiftable such as moving average crosses, RSI or stoc?
thanks
Philly, what is your exit rule? Often, an exit must be chosen to fit the entry.
Also, I’m not sure what the 15 minute gap rule is?
I’ve never tested MACD on 15 minute bars, so I can’t really say if the approach is profitable.
I would not encourage you to add other indicators until you first know whether your primary indicator works. A good system will typically not need more than 1 good indicator, and then maybe a few other features such as money management (stops, profit targets, and position sizing) and then a good exit.
I have seen other traders pair a 2nd indicator with the first, but it will typically be an indicator where the value is derived in an entirely different way from the primary indicator.
Do you have the ability to backtest this?
Thanks for the analysis. I have challenged many MACD adherents over the years to provide me with ANY statistical study that shows the MACD or Stochastics TA to be a predictive indicator for trading. No one ever was able to. I do remember finding one statistician who said it was no better than a coin flip, but I don’t recall who it was. I’ll check my records. Anyway, thanks for providing more data in this area.
Dave, no problem.
The problem with many of these indicators is that they were designed/built in a market that followed through on daily momentum. The current market (save for the last 6 months) has not followed through. Therefore, the way MACD works is not aligned with the current market regime. It would likely be better to fade the MACD over the past 10 years.
As for the coin flip, I still have the data and could probably figure pretty quickly what the next day’s edge is, in terms of win %.
Do you folks really understand what MACD is, and how it works? It is my primary analysis and trading and tool, and all I can say is, almost everyone I’ve read discussing it really has no idea how to use it. And I rarely see anyone change the parameters so that it fits the system in which they are using it for.
I use it in all time frames – monthly, weekly, daily, hourly, 15-minute, with different settings as needed. Those who stick with the default settings simply tell me that they don’t really understand how to use it.
In my opinion, anyone wanting to learn how to use MACD effectively should first learn how to use two exponential moving averages, and then learn how to use MACD without the signal line.
And if one can’t figure it out, they’re better off learning how to use a single period indicator like Stochastic or CCI.
Yes, I understand very well what MACD is and how it works. I also know how to use it.
What I have tested is the primary and most common use of it, with the standard settings. Certainly the settings can be tweaked, optimized, whatever. The problem is, most traders never bother, don’t know how, whatever, and they spout stuff about MACD this or that, and have no clue what they are talking about.
My point is, and maybe it wasn’t clear, is that the standard settings barely work over short time frames and have a negative edge over longer time frames. Furthermore, I know for a fact, that using standard settings and waiting until the MACD hits a relative extreme, and then fading it, has a decent edge.
Kudos for you finding an edge and using it to profit. If you would ever like to discuss more about it, or write about it, you can certainly leave some comments here or sign up for the peanut gallery.
Will do; I am in the process of testing certain parameters and trying to gauge effectiveness of buy/sell signals; I am observing right now with a weekly chart, a 4-13-4 setting (which you can also use a daily chart with 20-65, with an 8-9 signal line) for effectiveness of a particular buy signal, since I use a 13-week EMA for “longer-term”. I have been assuming (since I cannot recall reading Gerald Appel state this directly) that the standard 26-period default is originally tied to a weekly chart, since it represents 6-months and has been a commonly used EMA (Kirkpatrick uses it for his TA studies and Dr. Alexander Elder uses it), but so far I have found no valid use for it on a daily chart, where I instead use either a 20 or a 49 setting depending on which MR EMA I want to track. What you may find interesting (if you are unaware of it) is that a 26-period EMA on an hourly chart comes very close to being a 5-day EMA on a daily chart, so those who like the Red Bull trade with a fast EMA can use the default settings – I have an hourly chart set up with this 26-period EMA and a 130-period EMA, which is close to being the 20-day EMA, and I use this chart for timing my trade on a daily chart with the 20-day EMA setting. To blabber about hourly charts further, a 340-period EMA on an hourly chart comes close to being a 50-day EMA on a daily chart; note how 130 and 340 are both 10x actual Fibonacci numbers.
IMO MACD can produce 3 signals each way: a MACD line extreme above/below the centerline (with the histogram warning of waning momentum at the extreme), a MACD line/signal line crossover (the “histogram crossover”), and a MACD line centerline crossover (actual EMA crossover). Each has its advantages and flaws. Thus, it requires some discretion as to which signal a trader wants to act on, but as most folks I read tend to rely solely on the MACD line/signal line crossover, their entry seems to be less than ideal, primarily because this 3rd moving average (the signal line) has far less relevance (IMO) than the first two. As you know, MACD is a dual EMA crossover tool, and EMA crossovers have one major flaw – the second EMA turns quickly as well, so the actual crossover is more delayed than it is with one fast EMA and a second slower SMA (i.e., a Bollinger Band centerline). Since I focus my trading on reversals (buy low, sell high), I always look for what dual EMAs (via MACD) are quite effective in conveying, and that is momentum divergences, but this too requires discretion, so in order to keep things clear, I focus on trading a second MACD line extreme, and always if it is showing a divergence. I also believe that it is important to use a related indicator, PPO, to gauge past consistent extremes in percentages (“overbought”/”oversold”) and know when to be more attentive to potential reversals.
Finally, I should also say that I do NOT use MACD alone – I use ADX in conjunction with it; there are certain signals that ADX (both the DMIs and the ADX line itself) gives that provides better clarity about putting on a reversal trade and/or riding a trend. So for my bar charts, I always use MACD and ADX with 2 or 3 EMAs.
What might be interesting is if you were to try on a daily chart a MACD setting like 10-50, and test the well-known 10-50 EMA crossover, and gauge the results of a centerline crossover, rather than the signal line crossover.
Outstanding number crunching!
Something you might consider is showing the standard deviations of the daily returns to get a ‘signal to noise’ ratio. The higher the ratio (mean / stddev, or z-score), the more confidence one can have that you’ve found a real effect. Of course, there are all sorts of statistical tests for confidence, but you are now providing a map of the terra incognita, a great service.