I kindly request any quants and system developers to let me know if there is any data I present that seems to be out-of-line with your research or not congruent with the results from other similar tests.
When testing how well common indicators work, there must be something to which their performance can be compared. Simply put, a baseline is needed.
Developing a baseline has not been an easy task. I took the path that would allow the most robust results without exceeding the capability of my software, databases, and my free time. Still, these results are nowhere near perfect, although I do believe they will suffice. I will list some limitations of my approach to developing the baseline results in the footnotes.
The Frame:
I am a short-term trader. I typically do not like to hold positions for more than 20 days. Therefore, when I examine an entry as signaled by an indicator, I want to see immediate results. If it takes 10 days for a signal to produce results, then I have lost half of my allotted time-horizon, and my capital has been wasted due to opportunity cost.
In fact, I think that most traders expect that something should happen after any given indicator produces a signal.
Therefore, what we are expecting is that there will be a positive rate-of-change (ROC) produced immediately following a buy/sell signal being issued from any given indicator. Rate-of-change is a commonly used measure that simply calculates in percentage terms how much the value of a security has changed over X days. For example, using the closing price, the ROC1 (one-day Rate-of-Change) for SPY from Thursday to Friday was -0.02%.
Computing the Baseline:
Major Exchange Listed Stocks
If we are using ROC, then what we want to know is what has been the average ROC of all securities on any given day. While this is simple in concept, it is difficult to measure, primarily because the hundreds of millions of data points make the database very unwieldy.
My partner suggested that I use a random number function to randomly select securities from the database. This would, through repeated tests, provide a large sample size, yet each run’s database would not be too large for Excel to handle.
The process worked this way in AmiBroker: The random number function would compile the ROC1 of 5% of securities in my database, listed on any major exchange. The major exchange requirement filtered out OTCBB and Pink Sheets isssues. Each randomly selected security produced all of its history, in terms of ROC1. After each run, what I ended up with was a database of approximately 1 million rows, with each row containing the ROC1 for each day of security’s history.
Simply put, each database contains the complete history, in terms of ROC1 (what a stock did in percentage terms each day of its life) of 5% of the securities listed on a major exchange. I ran this test 20 times, making 20 databases, which provided almost 20 million one-day rates of change.¹ The average of each database was then averaged, which produced the result you will see in the graph below.
- The ROC1 averages across each database did show some variation. The highest average was 0.1223 and the lowest was .0723, which produced a range of .0499
- While the variation is a concern, I ran other tests previous to these, and the results of these tests are very similar to the previous tests, even though the method was different.
- There was very very little variation in the % Up Days.
The bulk of my database goes back to 1985, but there are some securities for which I have older data. As you will see, I have much more history for some of the broad indices.
The Broad Indices
I also want to compare the performance of indicators against the broad indices. For every index except the Dow Jones, I have all history available. For the Dow Jones, I could only go back as far as 1901.
I used the data on the indices exactly the same way as I did with the major exchange listed stocks, which was to figure each day’s ROC, and then average all the days together. I also counted the number of days the index closed up.
The Results:

There are some interesting trends in the above data. It appears that indices with more history exhibit less variation than those with a shorter history. It may also be explained by the law of large numbers, or perhaps it is simply survivorship bias.² Also, the standard deviation of the ROC1 (not published here) grew as the average ROC grew. This should be a reminder that higher volatility will produce a higher rate-of-change.
Throughout testing of the major exchange listed (MEL) stocks, the % Up Days exhibited very little variation. I’m curious as to why the % Up Days on the MEL stocks is much less than the % Up Days on the indices. If anyone can offer an explanation, or even a guess, I would appreciate the input.
Extrapolations:
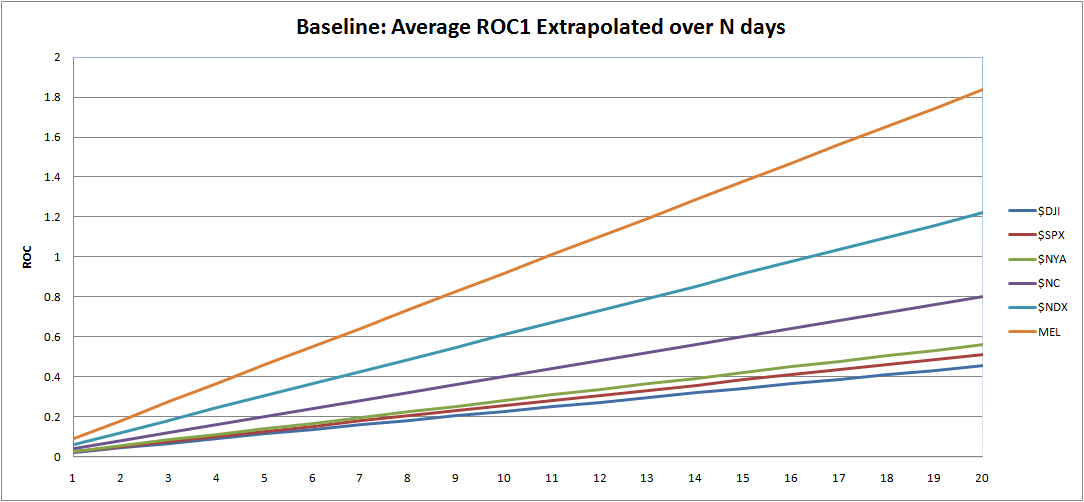
The above graph takes the average ROC1 of each index and adds the ROC1 to itself for each day going forward. I am going to use this graph in two ways.
First, we are going to look for what happens one day after the indicator gives a signal.³ An indicator that can produce ROC1 of .20 will beat the indices by a factor of 8 and will beat the MEL average by a factor of 2. (Imagine an indicator signal that produces a ROC1 of 1%. Now imagine that there are 10 opportunities a day. Theoretically, one could make 10 trades a day, averaging 1% in each trade.) The point is that we want to see the indicator immediately producing a ROC1 that beats the indices and the MEL average. If it does not beat these averages, then perhaps the indicator signal is to be faded.
Secondly, not every indicator is going to produce a high ROC1, right from the start. Perhaps the indicator is signaling that the conditions are ripe for a positive change over time, but not right away. To examine if this is true, I will record the ROC from 1 to 20 days out, and then plot these results next to the indices and MEL average. This may be hard to conceptualize, but once I start plotting the results, it should make more sense.
What’s Next?
I’m going to let this post float around the blogosphere for a few days in hopes that there is some commentary or criticism generated by quant/system trading bloggers. I want to be sure that the foundation of my research is sound before moving forward. If my baseline results are deemed robust, then I will begin testing the MACD, sometime this week.
Footnotes:
¹ I know that some symbols’ histories were randomly selected more than once. It is possible the same stocks were selected three or even more times. It is also likely that some symbols were never randomly selected at all, and therefore their ROC1 are not included in the average. Also, some stocks had histories that may have started in 2000, while others went back much further. Obviously a stock that IPO’ed in 2007 is going to produce an average ROC1 that will be much different from one that IPO’ed in 1990.
Stopping at 20 runs was a somewhat arbitrary decision. I could have run the test 40, 100, or 200 times, and then averaged those averages. I simply did not have the time to do that.
² I do not have delisted data, so survivorship bias is a concern.
³ I will eventually begin discussing ROC as Profits Per Day (PPD), as popularized by BHH at IBDindex. PPD describes what we are looking for, which is how much profits per day are produced by a given indicator over a given period of time.


I’m a little confused as to what you’re doing with ROC. If you’re producing an average ROC on each individual run – are you first averaging the ROC for an individual stock and then averaging the averaged ROCs of the selected stocks in the index? Or are you averaging all the selected stocks for a given day and then showing that as the daily average?
I’m guessing the latter but curious….I guess I don’t see why you can’t create a simple average ROC for any given day for all stocks across an index. Then you’ll have a much smaller set of data points and you can just average that. Thoughts appreciated.
Damian, let me try to explain it this way. Below I will make up some trades so you can visualize how they appear in the database. For AAPL, visualize the dates and ROC continuing to the present. Then, another symbol beginning with “A” is chosen. All history and ROC is placed immediately following AAPL. It cycles through the data base until the end, which may be something like ZBRA, or XOM.
Date Sym. ROC1
1/3/95 AAPL -1.21
1/4/95 AAPL .34
1/5/95 AAPL -.18
3/4/98 XOM -.23
3/5/98 XOM 1.54
In the list above then, I am average the ROC1 column. Most databases had about 1 million rows, looking like the 5 rows abovce.
So I am not averaging the ROC for an individual stock. I am averaging the ROC1 of all the history of 5% of the stocks listed on a major exchange.
Re: “I guess I don’t see why you can’t create a simple average ROC for any given day for all stocks across an index.” I like this idea.
So are you calculating ROC only for days on the trade? Or just in general to get a sense of the overall ROC of the stocks in an index? Again I’m guessing the latter.
I’ve created, for the NYSE, an average daily ROC1 – I’ll try and average all days and see if it is close to what you noted above.
What’s the data source you’re using?
Thanks Damian for helping with this.
I am doing the latter, of your two choices above.
I’m using Norgate data.
To your query above, I believe that your approach is superior to equal weighted index tracking since all indices contain a reconstitution bias, effectively making them long-term relative strength strategies. It is only natural that their up days are therefore higher than the random sampling method.
I also see comparing your model results to the average of all historical periods as problematic. Each epoch is unique in its behavior characteristics, therefore why not just compare current alpha versus historical alpha to see how edges are gaining or retreating?
In my opinion, a more thorough, perhaps more interesting base-line would be to create a small eco-system of competing peer models of similar pedantic underpinning. You could track the average of these peers and measure your subject model against this.
Best, Jeff
Jeff, thanks for the advice. I have received via email similar advice so I think that will be revising the baseline results in the near future.
Hi Woodshedder–I’ll post your link at my site–Maybe one of my readers can understand this–
Z!
Rob from Quantifiable Edges was too humble to leave this link in the comments section, so I’ve left it for him.
http://quantifiableedges.blogspot.com/2009/08/long-term-look-at-nasdaq-advancedecline.html
Thanks Rob, that helps a lot to explain the discrepancy.
Anyone who has started a business has been confronted with (or contributed to!) statistics of the form “7 of 10 new businesses fail in the first 5 years.” Similarly, the majority of tradeable firms underperform, but in the cap-weighted averages, the successful firms take on more weight than the less successful firms.
See http://blackstarfunds.com/files/TheCapitalismDistribution.pdf for research on this.
Great new endeavor, Wood. Thx!
You should not expect the ROC to increase linearly with time. The most accurate way to get longer periods would be to repeat the same method, but calculate the n-day ROC across all of your stock data. Your current method suggests that stocks go up by 2% a month on average, which seems a bit high.
The survivorship bias and other potential data sampling issues should mostly not be a problem. You have a sample of about 20 million potential 1-day trades. A meaningless indicator (completely random) will just randomly choose some of those days to trade, and should produce average results. An indicator that provides actual information will select days that have some non-average distribution. As long as you are comparing the indicator’s selections to all of its possible selections, the results will be informative. You might want to pull out the first 20-50 days of each stock’s performance, since the indicators require some data before they can generate reliable signals, so those first few weeks are not actually potential trading days.
The main place you will have a problem with survivorship bias is long-term mean-reversion strategies. The most obvious example would be buying 52-week lows. Most companies approaching bankruptcy will form a 52 week low. That will be a good buying opportunity for the companies that survive, but a bad one for the companies that get delisted. Any other strategy that is virtually guaranteed to be triggered by a company approaching bankruptcy will be affected by survivorship bias. The degree to which a strategy will be affected depends on how often the strategy triggers in bankruptcy situations as compared to regular situations. Something like RSI2 that triggers all the time is not likely to be affected very much.
Note that survivorship bias will also prevent you from seeing stocks in companies that have been acquired, which will have a more difficult to determine affect on the results, because you probably can’t reason out whether any particular indicator is likely to be set off by a company likely to be acquired like you can with a company approaching bankruptcy.
There are places that sell survivorship bias free stock databases going back as far as 1950. tickdata sells one for a fairly high price (but it is every tick or minute, not just EOD). http://www.premiumdata.net/ has delisted stocks going back to 1985 or 1950 for a few hundred dollars (EOD only). I haven’t used either of their data services, so I don’t know how good they are. There is also CRSP.