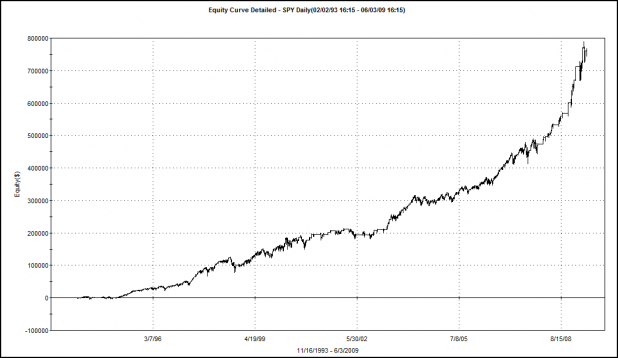
I thought the above equity curve might capture some attention. I’ll explain how we get to that beauty in a bit.
Over the last few weeks, I’ve been Deconstructing the Double 7s, analyzing the system metrics, and hoping that there might be an improvement that can be made.
Mikey may have saved me some time with his comment:
Says:
I tested 30+ different exits and exit combinations – time stops, % stops, time or 7DH stops, sell the next day after the signal (as opposed to the close), mvg avgs of the low or the close, W%R and ATR stop – before I ran out of time (this work was for a presentation to a small group of traders). The best stop was Sell the Close, the next best was an 8 day time stop, followed by Sell the Next day, 20 day time stop or 7DH, and then the 20 day time stop on its own.
Each of the five best exits had a normalized SQN (System Quality Number) above 2.0 that makes them tradeable according to Van Tharp to use position sizing to meet your objectives, but they are not ideal (for me anyway) as there is no downside stop with those time or 7DH stops.
Since I didn’t find any exits that I was comfortable with I didn’t move it into portfolio testing.
I have a feeling Mikey is no slouch when it comes to backtesting, so I’m thinking about trying one or two things that he didn’t write about trying.
But first, I’ve discussed adding a short component to the Double 7s, and its time to post the results.
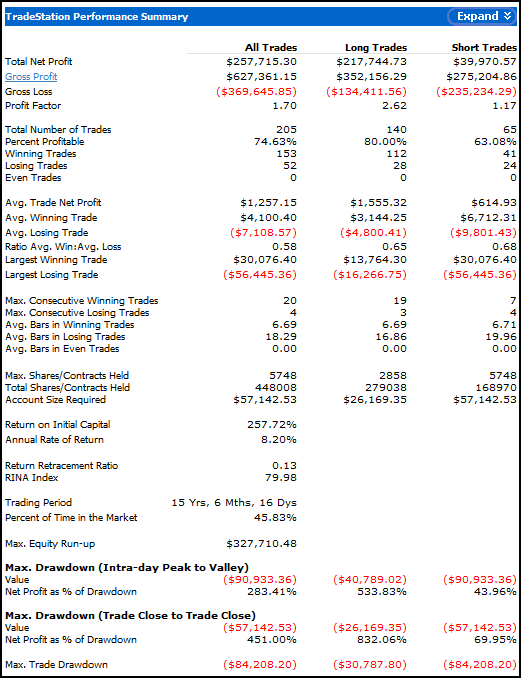
Below are the results for the system with short trades, on the SPY, tested with the same settings as in the previous posts. The short trade is exactly opposite of the long trades. The ETF must be beneath the 200DMA. The highest close of 7 days will be sold short. The trade will be covered on the lowest 7 day close.
Double 7s, Shorts Added, on the SPY
Double 7s Equity Curve with Short Side Added
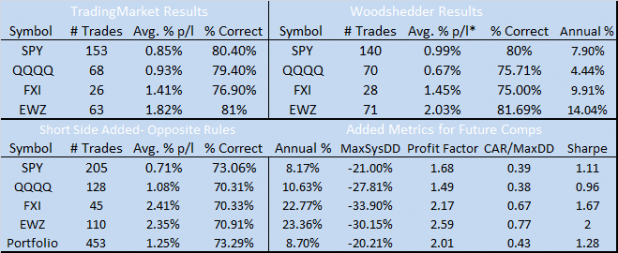
Comparisons Across ETFs, and Portfolio Results:
Some of the metrics may need explanation. MaxSysDD is the maximum system drawdown in percentage terms. CAR/MaxDD is the Annual % divided by the Maximum Drawdown. For example, if the system earned a compound annual rate of 20%, and the max drawdown is -10%, the CAR/MaxDD would be 2. The higher, the better.
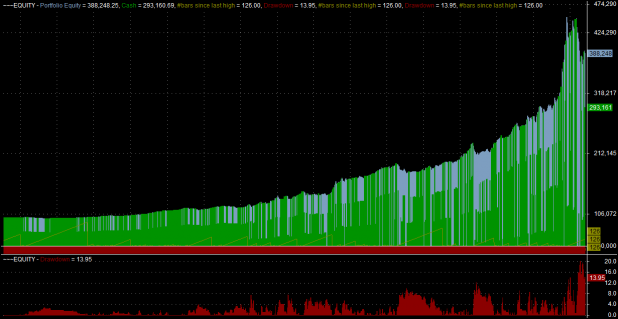
For the portfolio backtesting, each ETF (SPY, Qs, FXI, EWZ) was allowed 25% of total equity.
Portfolio Equity Curve:
Summary:
Adding the shorts increases the annual percentage in every ETF, but the SPY benefits the least from the addition. 2 of the other 3 ETFs double their annual returns when short trades are added.
I had hoped that drawdowns would be improved. While adding shorts smooths the equity curve, I’m not sure that they decrease the drawdowns.
Bonus:
One of the variables Mikey did not list as tested was changing the number of days used to calculate the entry and exits. The killer equity curve at the top of the post was generated by changing the system from a 7 day entry and exit to a 2 3 and 11 12 day system. For example, the system goes long at the lowest 2 3 day close and sells at the highest close of the past 11 12 days. It sells short at the highest close of the last 11 12 days and covers at the lowest 2 3 day close.
I’m curious if optimizing the n-day entry and exits is a viable strategy going forward. The next installment will look at these optimizations.
***Update*** Damian from Skill Analytics suspected that I had something incorrect, and he was right. I used the overstrike function to fix the errors two paragraphs above this one. Without going into too much geekery, just suffice it to say that the code must be offset, and I had forgotten to take the offset into account. All other calculations appear to be correct.


Nice write up. Some of the quoted stuff is interesting, is 7dh 7 day hold? If so how do you do a 7 and 20 together? Is sell on close a one day stop? How to calculate SQN? Maybe it is as it should be, but the 2-11 version leans heavily long, seems like below the 200 ma it’d test better to short more easily. My testing ignored the ma rule and used the same long and short number of days, over the last year it (no surprise) performed well with short periods
The killer equity curve at the top of the post was generated by changing the system from a 7 day entry and exit to a 2 and 11 day system
That’s what I get for not writing a post when I found a new system.
I discovered through an inference engine system that if one buys on the third day that SPY has dropped below the 3MA in a row and sells on the close where the close will not be beneath the 3MA that one can have a nice run even dodging the nastiness last October.
Nice work.
p.s. From 98 to 09 the best backtested system of that nature was to buy when the close was beneath the 37 MA after it had been beneath it for 75 days.
Mana, I’m hoping Mikey will chime in here. But until he does, here is my interpretation of his comments. 7DH is 7 day high. The 20 day time stop is not based on a higher close or lower close but instead is just a stop that has you close the position after it has been held for 20 days.
I would also like to know how to calculate SQN.
In regards to your comment: “Maybe it is as it should be, but the 2-11 version leans heavily long, seems like below the 200 ma it’d test better to short more easily.”
Remember that the short rules are opposite of the longs so that beneath the 200DMA, it is shorting an 11 day closing high and then covering quickly at a 2 day closing low. During the last bear market, there were evidently, with all the short covering rallies, a lot of 11 day closing highs. The short side performed very well.
Did you do any walk-forward optimization?
I had a comment but it was eaten and now WordPress won’t allow me to repost the comment.
Suffice it to say that there are some interesting plays in the whole vein of “if the market closes beneath xMA for x days (x does not have to be equal) then buy and sell when this condition is not true”.
Case in point, from 98 to 09 buying when the 37 day MA is breached to the lower after it’s been above it for 75 days would have been quite fruitful but has not triggered for about two years now.
Mr. Woodshedder,
I am a little off topic here, but I wanted to ask your opinion since I respect and appreciate your work so much. The question I have is about pyramiding positions. I use an intermediate trend following system; it works, I’ve made money over the past 3 years. However, the system as I’ve been taught calls for pyramiding (in my opinion fairly aggressively). I normally don’t pyramid, but simply trail my stop higher using ATR. On the occasions when I have decided to pyramid, I seem to always end up with small losses or scratches at best. Could you please give me your thoughts on this technique.
I was curious about the SQN (seems to be one of Van Tharp’s ideas) and used the Great Oracle that is Google…from a post on the NinjaTrader support forums:
Assuming a set of N trades (N>30 for being statistically significant), SQN is defined as follow:
SQN= Squareroot(N) * Average (of the N Profit&Loss) / Std dev (of the N Profit&Loss).
The large the N, the more trading opportunities you have.
The large the average P&L, the better you are obviously.
The smaller the Std dev (P&L), the more regular are your results and the smaller are the drawdowns.
Note here that if you optimize for the largest SQN, you maximize in fact the product N*average P&L and you minimize the Std dev (P&L) and the drawdowns at the same time.
ktb
Hey Wood – I’m unable to duplicate the equity curve above in Amibroker – wondering if you’re using the exact same rules?
Thanks Wood. You are right, I only tested the exits, not the entries. And yes, 7DH = the highest high of the last 7 trading days, and a 20 day time stop means to sell on the 20th day you have been in the position, at the close.
(Using time stops is a good way to test the efficacy of your entries. If you get an entry that is a winner 55%-60% of the time or better using a time exit that corresponds with the general time frame of the trade, i.e. 2 day for a swing trade, then you start off the trade with a better than chance beginning.)
As for the SQN, if N is your sample size and R is the variable that represents your risk on each trade, then SQN = SQRT(N) * (Avg R/STDEV(R)). I have found using the SQN to allow me compare various system performance is helpful. However, there are a few things to point out about this calculation.
First is the sample size. You need at least 30 to have a statistically significant result. However, if I am going to put any level of real money at risk then I want to see at least 100 trades. If you compare systems with varying sample sizes then you can run into an issue with getting a SQN that seems to show one system better than another. However, it is only so because one has a larger sample size compared to the other. So I use what I call a “normalized SQN” where if the sample size is greater than 100 then I use 10 in place of the SQRT of N. In my Double 7 testing I used 10 in place of the SQRT of N because the sample size varied by system and most were over 800 trades.
The second issue is mentioned by KTB, and that is what moves the value of the SQN up. This measurement favors a high win rate combined with a low variability in results. So, a trend following system would have a lower SQN than a high probability scalping system that wins 1R or loses -1R or less. That is not to say you can’t make money with the trend system, it is just that this measurement will show it to be less desirable.
The third one, and the one I find the most challenging, is that it actually punishes upside variability. So, lets say you have two systems, 30 trades each – each with 10 one R losses, and one has 20 three R wins, and the other has 15 three R wins plus 5 five R wins. The SQN of the second system will actually be lower even though it makes more money. It would seem to me a measure of the downside variability only might be a better approach for system measurement, but I am still working that out.
I will say this – Tharp’s SQN was developed to allow you to position size to help you MEET YOUR OBJECTIVES from a $ perspective. So in that case, having low variability across the system (both upside and downside) will help you meet your needs faster and more consistently than if you are waiting for the outlier wins that boost your total returns. Especially if you are using a % position sizing model or something similar. So, for what he built it for, it works. For what I am looking for – a system comparison metric – it is not ideal but works for now until I can figure out one that fits my needs better.
Great thread Wood, thanks for doing it. I look forward to the next installment.
Damian, I will look into that. I think that I may have inadvertently not accounted for the offset.
When I get home, I’ll email you my code and settings.
I caught up with this thread and was amazed at the comments. I’m going to start review some of my systems with SQN.
Mikey, thanks for coming back and lending us some more knowledge. When I get home from work, I’ll have some time to respond.
Beano, I have never designed a system that pyramids. I have tested pyramiding on some existing systems. For mean reversion, it can really juice the returns. I will add more thoughts on this when I get home from work.
Damian is right. The killer equity curve was actually generated by a 3 and 12 setting. I edited the post to reflect the error.
Mikey, thanks for the SQN explanation. Have you checked out the Sortino ratio? I understand it doesn’t punish upside variability like the Sharpe and SQN.
http://en.wikipedia.org/wiki/Sortino_ratio
Yes I have thanks. It is part of my consideration for a system measurement tool. I was thinking of potentially combining them or looking at them in concert but haven’t gotten there yet.
When visiting blogs, I generally discover a really great content like yours
I would like to convey my admiration for your generosity in support of men and ladies which have the need to have for help with this particular concern. Your unique dedication to getting the message all over had been wonderfully productive and have all the time produced experts a lot like me to attain their dreams.