If you need an introduction to the Double 7s series, go here.
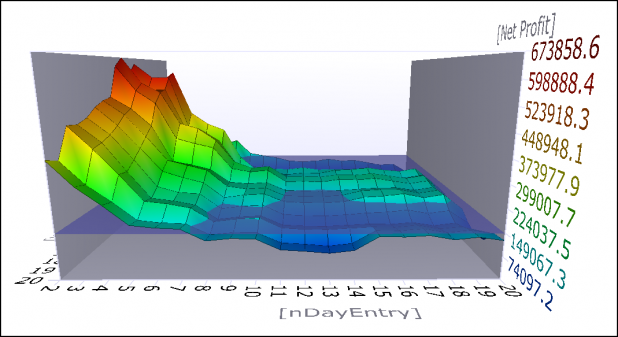
The graphs are the result of running an optimization report in AmiBroker. Testing in Tradestation yielded an optimum setting of 2 and 11 days, rather than the 7 and 7 as publicized by TradingMarkets. The AmiBroker report confirms the Tradestation results.
Some explanations are in order. The nDayEntry represents entering on the lowest close of n days for longs and exiting on the lowest close of n days for shorts. So while it says entry, it is only the entry for the longs. It is the exit for the shorts. Note that the entry edge falls off fairly quickly, as does the exit edge for the shorts. The textbook 7 day entry looks like nothing special and only returns 1/3 of the optimized entry and exit.
The blue underwater mark is set around 150K, but since this system did not lose money, technically nothing is underwater.
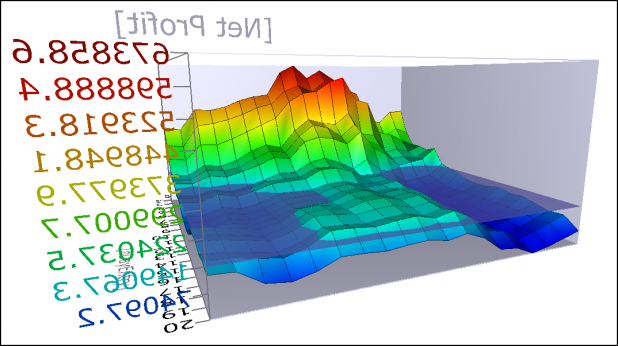
The above graph is the same as the first, but it has been rotated to show that the zone of profit for the nDayExit is large, and does not have a lot of individual spikes. Spikes can show areas where a variable does not provide robust results. The highest area represents the result of exiting longs on the highest close of the past 12 days and initiating shorts on the highest close of the past 12 days.
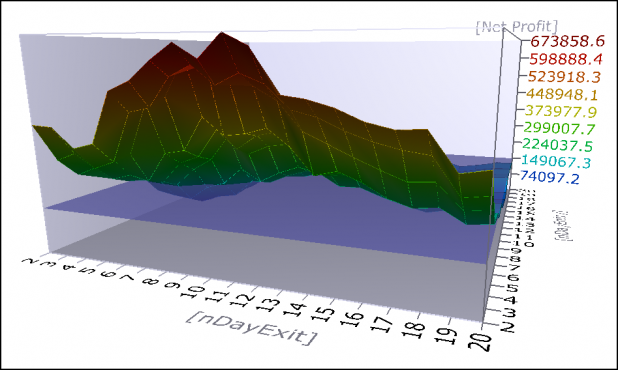
Again, same graph from behind. I included this view to clearly show how the exit days for longs (entry days for shorts) have a fairly large edge. The textbook 7 day high close exit is better than the 7 day low close entry.
Honestly, I’m very surprised by how large this edge appears to be. Granted, the optimizations were run over the entire data set, with no consideration given to in-sample or out-of-sample testing.
Bonus:
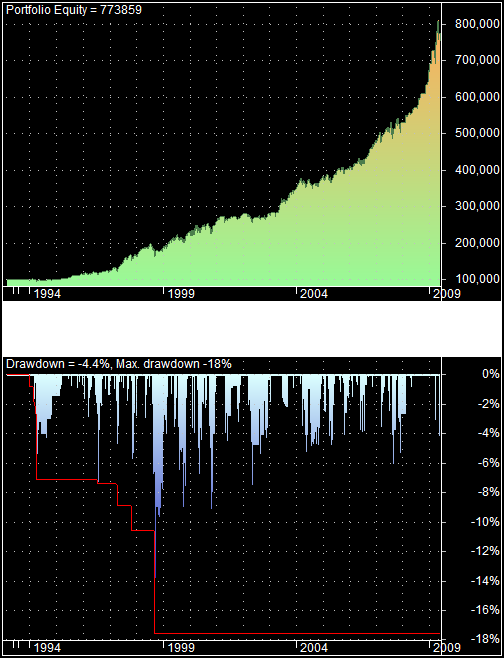
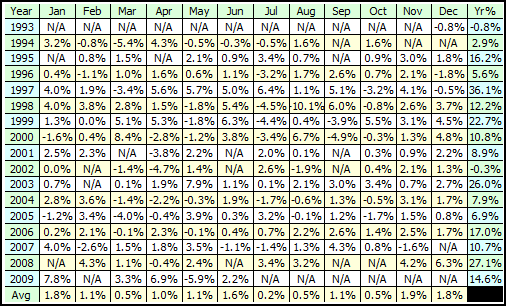
The latest beta version of AmiBroker includes an upgrade to the reports section. I’m going to include some of the charts it now generates automatically.
The more I look at this equity curve and drawdown profile, the more I like it! I am a little troubled by the curve going parabolic. How long can that profile be sustained?
The system has only lost money over 2 years (remember, the testing is frictionless).
I think that the next tests I run will attempt to use position-sizing and leverage to improve returns and decrease drawdowns. As much as I’d like to apply stops to the system, as Mikey found, there are not likely to be any stop strategies that can decrease risk without seriously limiting the performance. Instead, I’ll try to accomplish the same thing with dynamic position-sizing.



Check your email.
Ah, shi’, now you’ve done it, Woody.
The Fly has written you an ‘official reprimand’ in letter form for blowing his mind with 3D charts.
Colorific!
I think Woody’s on acid with those colorific 3-D charts
Sheeeyit!
I wish I was on acid, considering my large SPY short position and the NFP report.
Hang in there with those shorts wood, I’m thinking about dumping the rest of my big caps here. That jobs number was bogus, this is a blowoff top.
Scum, yep, the position is almost back in the green!
Mountainous charts!
I would like to hike and climb around in those charts.
I ain’t sayin shit.
lol Lazy..Certainly some interesting trading today.
Alpha, you know I’ve never spent any time out West? I spent 3 days in Tahoe, that was it. Farthest west I’ve besides that is St. Louis area.
This performance data is for the combined long and short signals, right? Nice job Wood.
Hey Wood, the bond market really likes your shorts. 😉
Mikey, yes, long and shorts. What do you think about that? The optimization shows a fairly broad edge, no? I am really surprised.
The problem is that there is still no way to manage risk, as you discovered.
What if on a long entry there is not a close on x day highs and then the market comes down? is there a further condition to exit long if close is below 200 day m.a.? Thanks
Pretty portion of content. I simply stumbled upon your site and in accession capital to say that I get actually enjoyed account your weblog posts. Anyway I will be subscribing for your augment or even I achievement you get right of entry to persistently fast.