iBankCoin
Home / 2008 / August (page 2)

Monthly Archives: August 2008

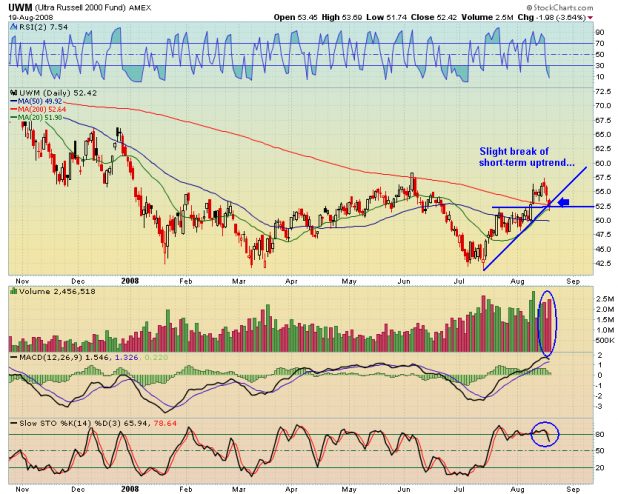
Looking For a Bounce

The markets move both ways. I view extended moves that happen in one direction, a la June and early July, as anomalies. What makes that type of move odd is that there were really no herky-jerky type spikes and pullbacks–just a straight move down.

What I’m looking for the rest of this week is a spike, of the herky-jerky type, if you will.

The Russell 2K, represented here with the [[UWM]] is short-term oversold and is sitting right at 3 levels of support: 20 & 200 Day Moving Averages, the Uptrend Line, and Support above July and August resistance. The 50 day moving average is sitting a couple of points beneath Tuesday’s close. Due to these factors, I’m looking for a bounce.

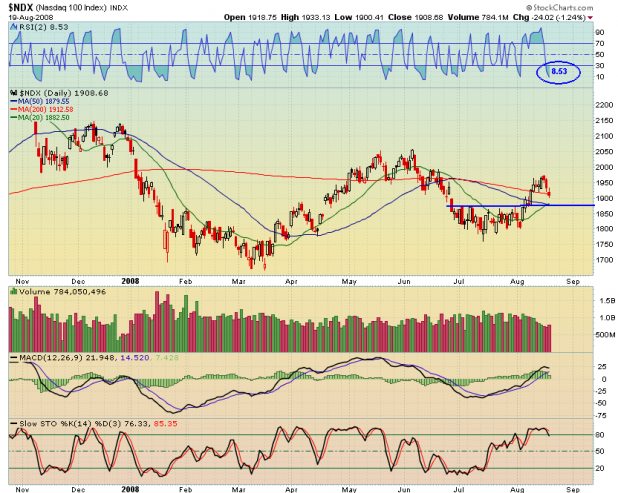
All eyes have been on the Nasdaq 100, over the past month or so. Similar to UWM, the NDX is sitting near multiple levels of support. It is short-term oversold.

Note the 20 day average is crossing above the 50 day average. More on that in a later post.

For this type of set-up, where I’m looking for a short-term bounce from oversold conditions, I want to buy strong stocks that have pulled back, holding them for a week or less, and cutting them loose quickly if they move against me. The following list encompasses the type of stocks I like for this setup.

National Semiconductor Corporation [[NSM]]

Adobe Systems Incorporated [[ADBE]]

The TJX Companies, Inc. [[TJX]]

Atheros Communications, Inc. [[ATHR]]

Red Hat, Inc. [[RHT]]

Concur Technologies, Inc. [[CNQR]]

Thoratec Corporation [[THOR]]

Immucor, Inc. [[BLUD]]

CSG Systems International, Inc. [[CSGS]]

Acxiom Corporation [[ACXM]]

CONMED Corporation [[CNMD]]

Greenfield Online, Inc. [[SRVY]]

National Instruments Corp [[NATI]]

Veeco Instruments Inc. [[VECO]]


Comments »

Looking for a Pullback

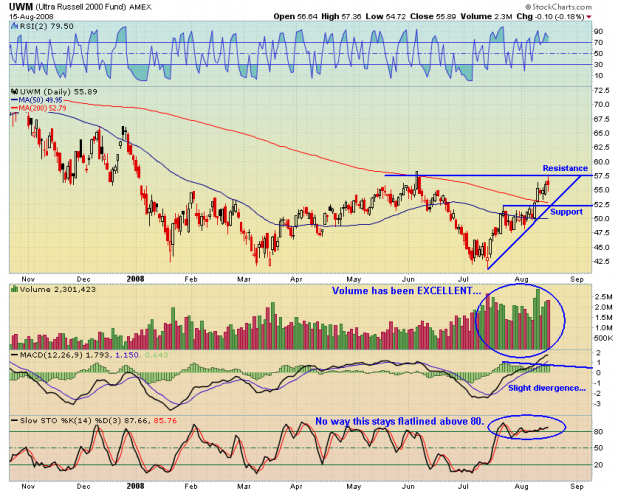
The Russell 2000 has been ripping higher, but has now reached a rather obvious point of resistance at the June high. The current trajectory is unsustainable and will be checked again soon. I’m looking for a pullback to at least $52.50

Some things to note about the [[UWM]] : Volume on the move off the bottom has been absolutely awesome. There has been some serious accumulation going on.

MACD is still strong, but is showing a slight divergence. I expect it to start rolling over. Along the same lines, the Stochastics are due to spend some time beneath 80.

What I am watching for is a break of the uptrend line, which started from the July low. A break of the line will mean the trajectory is slowing.

I ran a test tonight on the IUX, going back to 1994. A buy signal was generated when the Russell closed above the 200 day, and a sell was generated when it closed beneath the 200 day average. The average losing trade lasted 7.65 days. As this system would have had you in the Russell for 5 days now, if the index does not reverse back beneath the average, sometime this week, it is likely that it will remain above it for the next 4 months, on average.

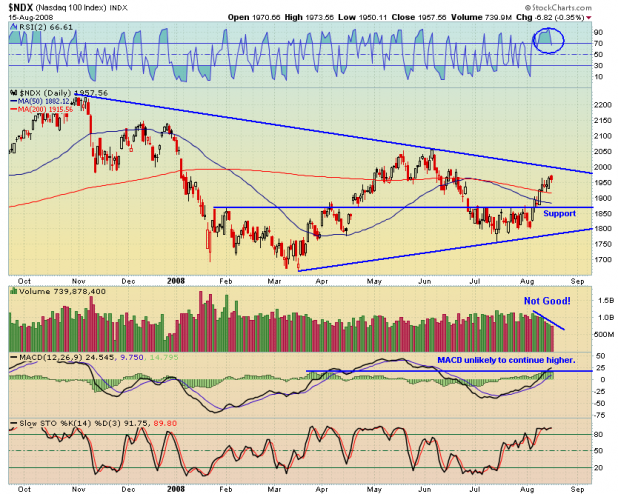
Up next is the NDX, which is the Nadaq 100 index. This one has also been strong, although it is showing signs that momentum may soon slow.

The NDX is approaching primary resistance, extending from the October 2007 high. As a contrast to UWM, volume has been slowing on the move up, which is never good.

The MACD is at a level where a reversal typically occurs, and RSI(2) has carved out an extended, albeit short-term, top.

I ran another test tonight, on the NDX, going back to 1985. The buy signal was a close above the 200 day moving average and the sell signal was a close below the average. The average losing trade lasted 10 days, while the average winner lasted 147 days. As the NDX has closed above the 200 day average for 5 days, we should watch closely to see what happens over the next week. Should the index remain above the average, I will consider the possibility of a multi-month bottom being in place.

I am still leaning long, and will continue to buy both breakouts and weakness in strong stocks. However, I will enter some double inverses tomorrow to play the downside that I am expecting.

Comments »

The Daily Breakout

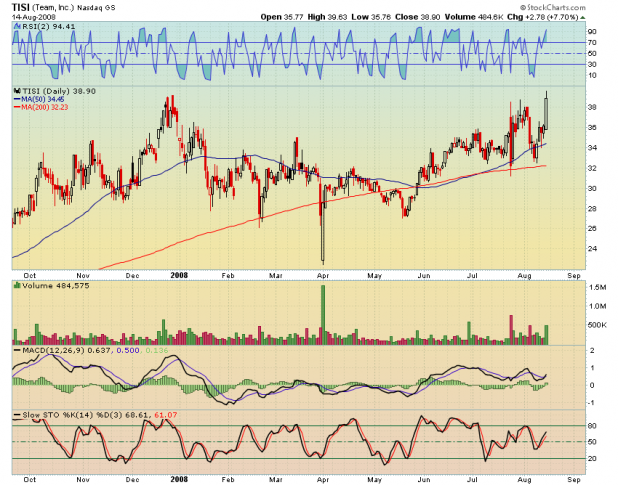
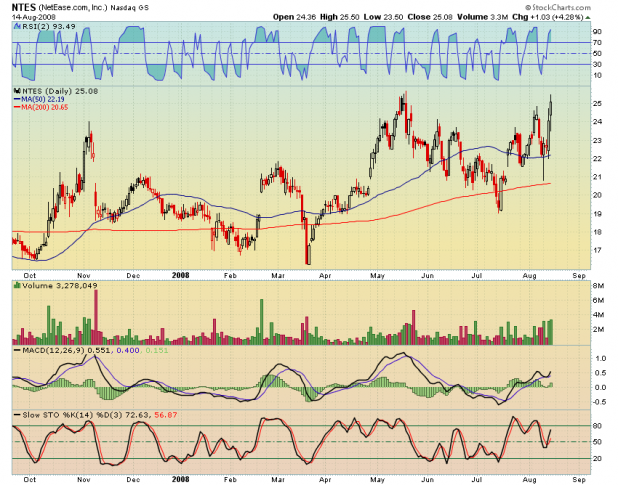
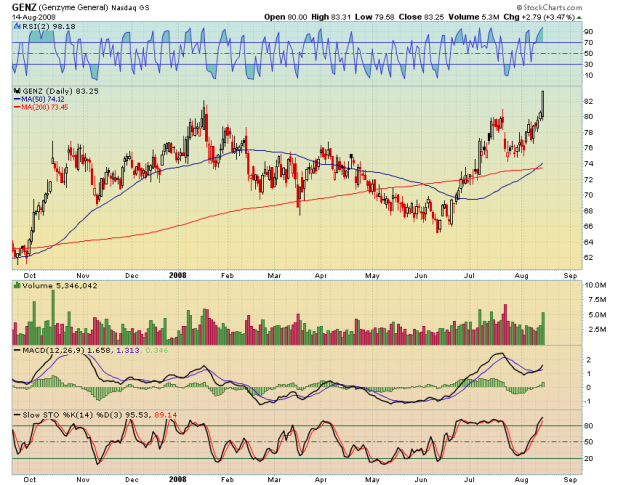
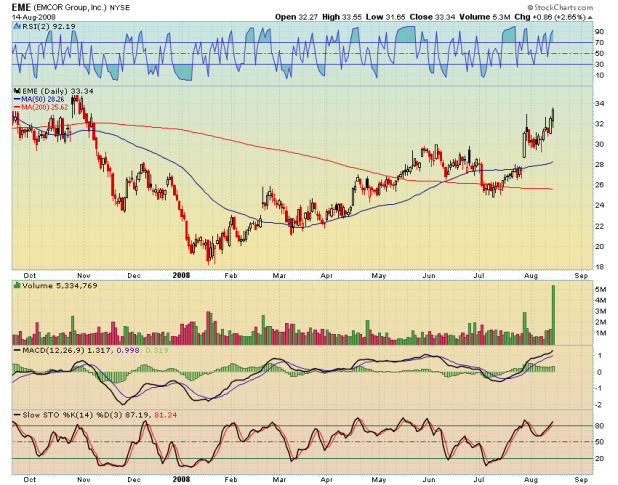
After two days of no breakouts to speak of, today’s strength resulted in four beautiful breakouts.

Team, Inc. [[TISI]] Good volume, great cup-with-handle.

NetEase.com, Inc. (ADR) [[NTES]] Not the most perfect pattern, but the volume has been outstanding.

Genzyme Corporation [[GENZ]] What a fantastic looking breakout!

EMCOR Group, Inc. [[EME]] Check out that volume. This one looks as if it may go parabolic.

Comments »

Sir Psycho Sexy

Well, I’ve messed around tonight and ran out of time to write something meaningful.

So, I’ll write about an album I’ve rediscovered, thanks to my 17 year old.

The album is the Red Hot Chili Peppers: Blood Sugar Sex Magik. I believe it has to be ranked in my top ten favorite albums. We’ve been riding around blasting it everywhere we go. I remember doing the same thing with the CD when I was just a year older than he is now. Good times!

Sir Psycho Sexy is one of my favorites from the album.

Comments »

A Look At 4 Closed Trades

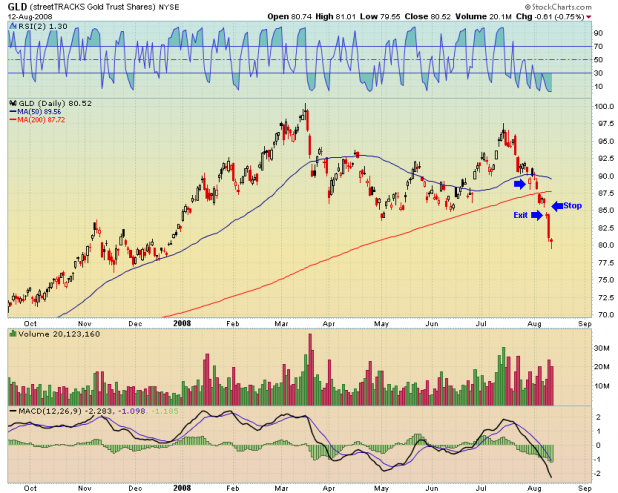
I will start with my trade in GLD, as I immortalized the setup in the post, Don’t Think, Buy GLD.

In the post, I wrote, “Choose a stop based on whatever you want, but obviously, the 200 day average and the trendline must not be violated.” I wanted to give [[GLD]] a chance to break through the 200 day and reverse, and not get stopped out, so my stop was at $85.05 The stop worked very well, until GLD gapped beneath it. I recorded a loss of 5.73%

I would like to note that GLD is ridculously oversold, and will bounce, very soon, in my estimation. Again, you’ve go to use a stop on these types of trades, and as I’ve shown here, some trades will gap beneath your stop.

————————————————————————————

The following three trades were closed Monday, August 11th.

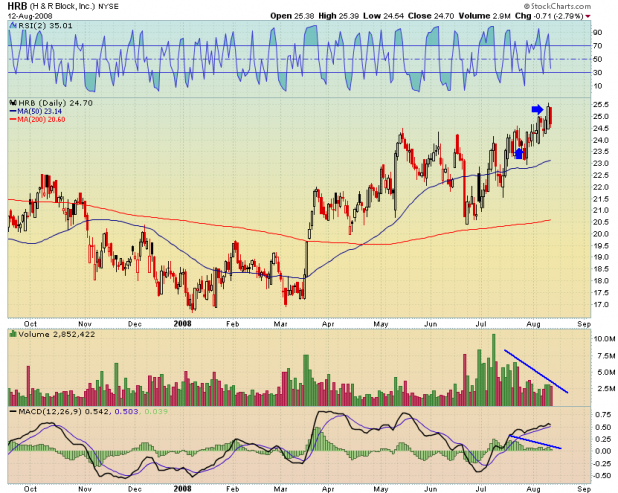
 H&R Block, Inc. [[HRB]] was a trade I talked about a bit.

Gain of 3.51%

I sold this one as I felt it was especially susceptible to headline risk, and because the MACD was rather weak for a new high, as was volume.

————————————————————————————-

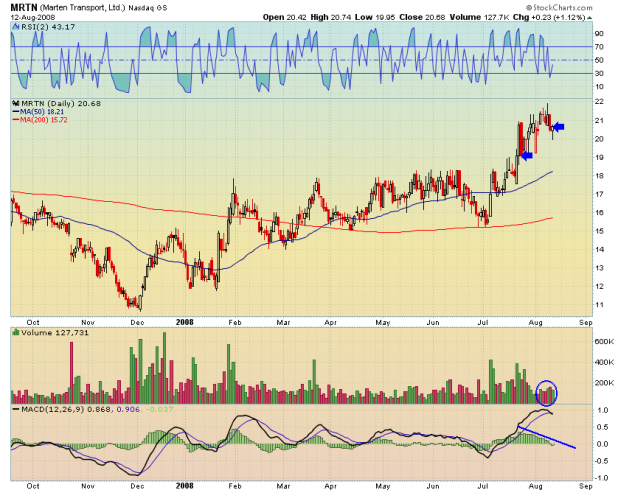
Marten Transport, Ltd [[MRTN]] was my play on falling oil.

Gain of 7.62%

I sold this one because it quit responding to drops in crude prices, the MACD was crossing, and volume was weaker than I liked.

————————————————————————————-

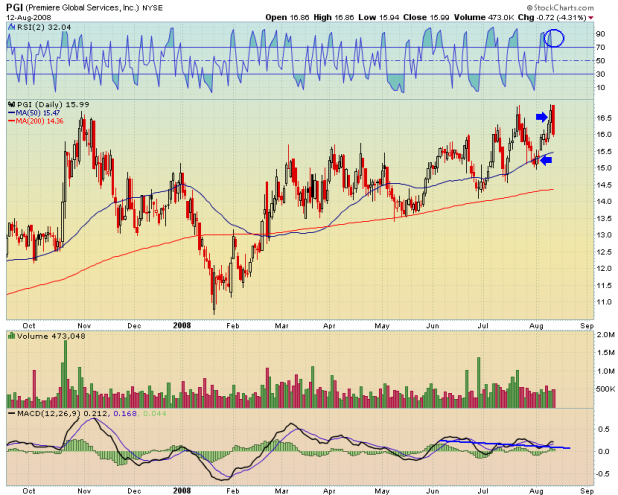
Premiere Global Services, Inc. [[PGI]] was an easy trade.

Gain of 7.18%

This trade was well executed. I think this one will go higher, but I pegged the entry, so it made sense to peg the exit as well.

Comments »

Backtesting: Buy the Nasdaq Above The 200 Day Average?

More simple testing of what happens after price crosses a major moving average.

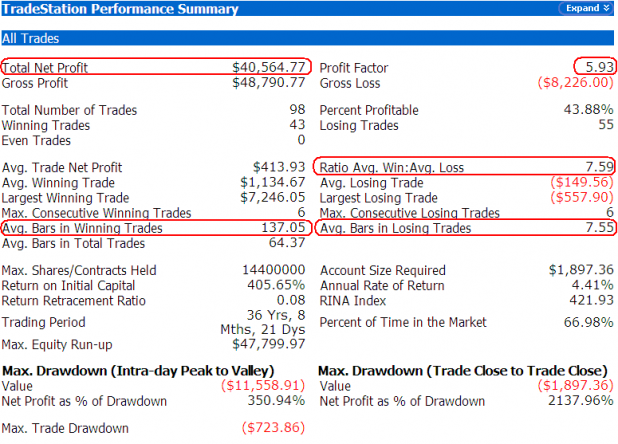
For this test, I used the $COMPX, tested from today to February 5, 1971.

Rules: Buy the next open after price closes above the 200 day average.

Sell the next open after price closes below the 200 day average.

$10,000 per trade.

This simple system is profitable. The profit factor and ratio of average win to average loss is worth noting as it is very good.

Also, the win percentage of 43.88% is consistent with that of trend following systems.

What jumped out at me, as I try to determine what my bias should be over the next few weeks, is the number of days one would be in this trade before it loses (Avg. Bars in Losing Trades). If this trade is going to fail, on average it fails within approximately 8 days. What I take from this is that if the Nasdaq can maintain the 200 day moving average, for a couple of weeks, then I need to be considering the reality that the Nasdaq has bottomed.

Along the same lines, the average winning trade lasted for 137 days. It would not be fun to fight that kind of trend, on the short side.

These statistics highlight that the Nasdaq has closed at a critical level today, as it closed 2 points over the 200 day average.

Comments »

Backtesting: Buy the S&P 500 Above the 50 Day Average?

Danny’s recent post reminded me of a good many assumptions that I possess. Mainly, through eye-balling many charts over many different time periods, and doing some calculations by hand, I developed the idea that the best time to buy during a bear market period was when the index price closed above the 50 day average.

I should have examined this bias months ago. Better late than never.

Here are the rules:

1. Buy the next open after the S&P 500 closes above the 50 day average.

2. Sell the next open after the S&P 500 closes beneath the 50 day average.

Obviously, this a very very simple strategy. There are very simple improvements we could make to it that will drastically improve performance, but that is not my goal, right now. What I want to examine is some baseline performance metrics, and then I want to compare the baseline metrics against performance during the 2000-2002 and 2007-2008 bear markets. The results should allow some assumptions to be made about the validity of my bias.
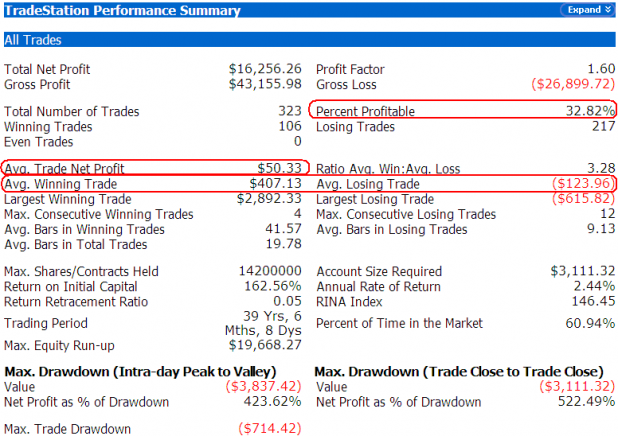
The above performance report starts on Friday’s close (8/8/08) and goes back 40 years. I’ve used the $INX, which is what Tradestation needs to backtest the S&P 500.

I have outlined in red the metrics I will focus on.

First, the system is profitable. However, it loses a lot more often than it wins, but that is typical of a trend following / moving average system. Secondly, the average trade is profitable, to the amount of 50 bucks. The average win is 3.28 times larger than the average loss. The largest winning trade swamps the largest loser, but that large winner is probably an outlier (I didn’t check to be sure).

Note the 12 consecutive losing trades in a row. Position sizing and risk management is a must if one is trading a system.

These metrics will serve as our baseline, to which we will compare the data from the 2000-2002 and 2007-2008 bear markets.
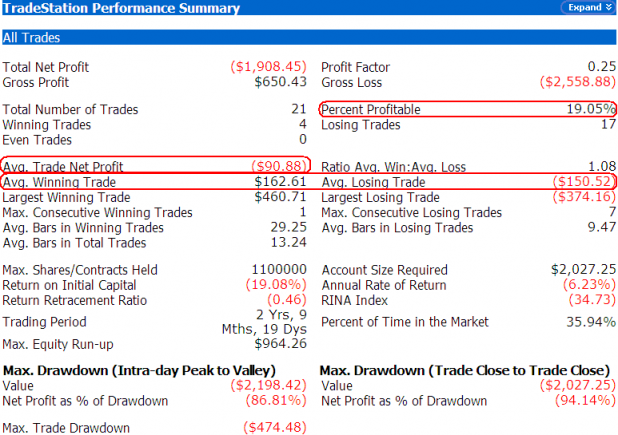
The above data is the results of testing from 1/10/2000–1/10/2003.  I chose these dates as it gives us a couple of months of data on either side of the start and end of the bear market. In hindsight, we can determine the start and end, but in real-time, we would not reliably be able to make that determination.

Compared to our baseline metrics, we see that during this period, the system was not profitable. The average trade results in a loss. The average winner is almost the same amount as the average loser. The win percentage dropped down even lower, to 19.05%. There were 7 losing trades in a row.

Obviously, this system does not work well during a bear market.

Lets look at the current period.
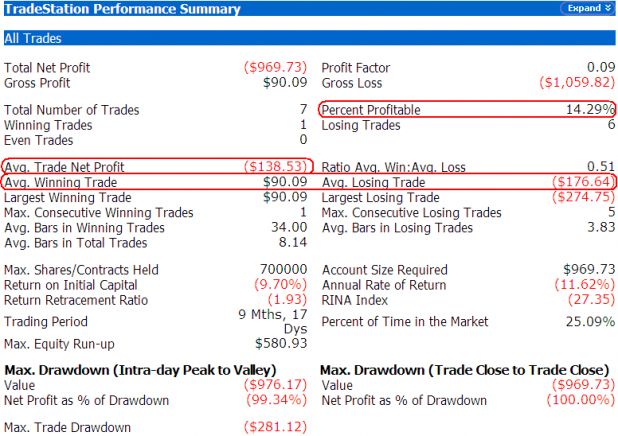
The above results are from 8/8/08 to 8/10/07. The results are very similar to the 2000-2002 bear market. The system is not profitable, and the performance is getting worse. Now, the average win is half the average loser, and the win percentage is even lower at 14.29%. The system has had 5 losing trades in a row.

Conclusions

As the S&P 500 closed Friday less than 1 point beneath its 50 day moving average, it is important to consider the above results.

Buying tomorrow could be a purchase on the first day of a new bull market. Or, it could be a losing trade.

While over the long term, buying the S&P 500 when it crosses above the 50 day average has an edge; in the current environment, it will be necessary to develop a robust exit strategy. Simply selling when it crosses back beneath the 50 day is not enough.

As I alluded to earlier, adding some additional variables and conditions to this simple strategy will improve the results. I will examine these issues in the future.

Comments »