Danny’s recent post reminded me of a good many assumptions that I possess. Mainly, through eye-balling many charts over many different time periods, and doing some calculations by hand, I developed the idea that the best time to buy during a bear market period was when the index price closed above the 50 day average.
I should have examined this bias months ago. Better late than never.
Here are the rules:
1. Buy the next open after the S&P 500 closes above the 50 day average.
2. Sell the next open after the S&P 500 closes beneath the 50 day average.
Obviously, this a very very simple strategy. There are very simple improvements we could make to it that will drastically improve performance, but that is not my goal, right now. What I want to examine is some baseline performance metrics, and then I want to compare the baseline metrics against performance during the 2000-2002 and 2007-2008 bear markets. The results should allow some assumptions to be made about the validity of my bias.
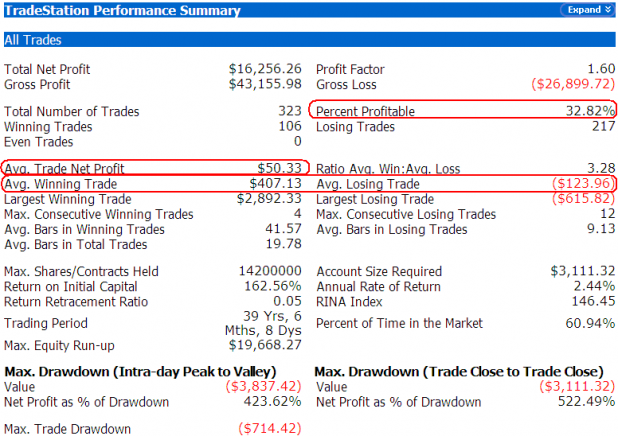
The above performance report starts on Friday’s close (8/8/08) and goes back 40 years. I’ve used the $INX, which is what Tradestation needs to backtest the S&P 500.
I have outlined in red the metrics I will focus on.
First, the system is profitable. However, it loses a lot more often than it wins, but that is typical of a trend following / moving average system. Secondly, the average trade is profitable, to the amount of 50 bucks. The average win is 3.28 times larger than the average loss. The largest winning trade swamps the largest loser, but that large winner is probably an outlier (I didn’t check to be sure).
Note the 12 consecutive losing trades in a row. Position sizing and risk management is a must if one is trading a system.
These metrics will serve as our baseline, to which we will compare the data from the 2000-2002 and 2007-2008 bear markets.
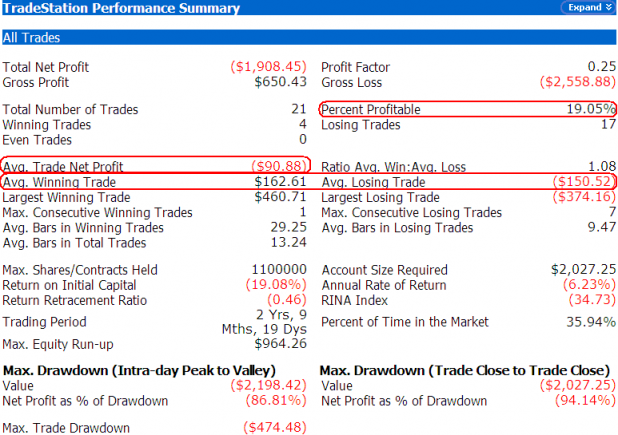
The above data is the results of testing from 1/10/2000–1/10/2003. I chose these dates as it gives us a couple of months of data on either side of the start and end of the bear market. In hindsight, we can determine the start and end, but in real-time, we would not reliably be able to make that determination.
Compared to our baseline metrics, we see that during this period, the system was not profitable. The average trade results in a loss. The average winner is almost the same amount as the average loser. The win percentage dropped down even lower, to 19.05%. There were 7 losing trades in a row.
Obviously, this system does not work well during a bear market.
Lets look at the current period.
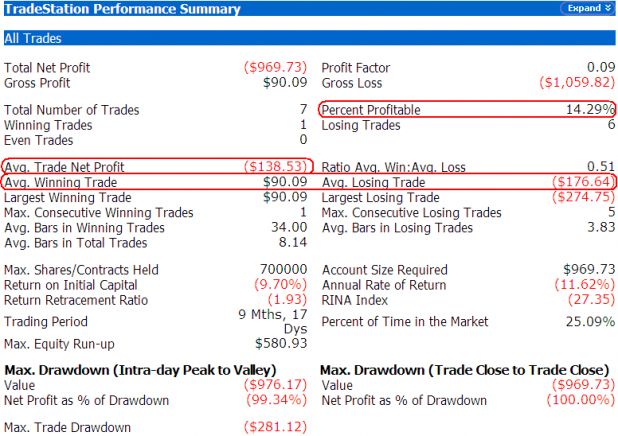
The above results are from 8/8/08 to 8/10/07. The results are very similar to the 2000-2002 bear market. The system is not profitable, and the performance is getting worse. Now, the average win is half the average loser, and the win percentage is even lower at 14.29%. The system has had 5 losing trades in a row.
Conclusions
As the S&P 500 closed Friday less than 1 point beneath its 50 day moving average, it is important to consider the above results.
Buying tomorrow could be a purchase on the first day of a new bull market. Or, it could be a losing trade.
While over the long term, buying the S&P 500 when it crosses above the 50 day average has an edge; in the current environment, it will be necessary to develop a robust exit strategy. Simply selling when it crosses back beneath the 50 day is not enough.
As I alluded to earlier, adding some additional variables and conditions to this simple strategy will improve the results. I will examine these issues in the future.


Nice analysis. A simple question (from my simple mind that has to use logic instead of math)… If this strategy is not overall profitable in a bear market, would it make any sense to find out what would happen if you did the opposite? To me the opposite would be the equivalent of selling into any strength/rallies if the S&P 500 crosses above the 50 day average.
The flaw I can see in doing the opposite is that you never know for sure when the bear market is over (until afterwards) and you could have a big opportunity cost due to not participating in the last rally (or series of rallies) that lifts you out of a bear market.
Boca, that is a great question. The answer is probably yes, but then your 2nd paragraph identifies the rub.
Honestly, there are vast improvements we could make to the system, simply by changing the length of moving average. Ideally, a system is developed that works GREAT in the optimum environment and doesn’t destroy your account during sub-optimum periods. Some of that gets into curve-fitting and optimization, but there are techniques like testing on out-of-sample data that can alleviate some of the concerns.
Finally, one shouldn’t be allocating 100% of capital any one strategy.
now, just to be clear, what you tested is NOT what I tested for.
“Honestly, there are vast improvements we could make to the system, simply by changing the length of moving average. Ideally, a system is developed that works GREAT in the optimum environment and doesn’t destroy your account during sub-optimum periods.”
I like that thought very much. I really hope you keep testing and refining the parameters.
I understand that Danny, but I’m glad you mentioned it. Your test will take more study for me to really grasp the implications for my own trading.
Shed’s example of testing a favorite assumption (which was one that I shared btw) was simple enough for this non-math expert to follow, and the system is also simple enough to be pertinent to my trading. I think my trading style will always emphasize simple in preference to complex.
Danny, you added the condition that price must also be above the 20 day average, and you sell when price is beneath both the 20 and 50.
If I have it correctly, adding that condition deteriorates performance, over 40 years of data, more than using just the 50 day.
Total Net Profit $6,820.43 Profit Factor 1.14
Gross Profit $57,073.60 Gross Loss ($50,253.17)
Total Number of Trades 665 Percent Profitable 35.49%
Winning Trades 236 Losing Trades 429
Even Trades 0
Avg. Trade Net Profit $10.26 Ratio Avg. Win:Avg. Loss 2.06
Avg. Winning Trade $241.84 Avg. Losing Trade ($117.14)
Largest Winning Trade $2,205.20 Largest Losing Trade ($558.48)
Danny, it looks like in the data I put in the above comment, tradestation was not using above the 20 AND above the 50. It looks like it was taking either condition. I’m not sure, but looking at your data files against mine, I think that might be happening. I’ll have to go back and make sure TS is taking the trade only if it is above BOTH moving averages.
There is some beauty about only relying on charts. The phrase “ignorance is bliss” comes to mind.
With charts, one only has to look at price action, while ignoring news and life. I like it.
I might become a technical analyst soon and “trow” up some charts, while using Tony’s computer, in the back of his Brooklyn pizzeria.
NO! if price falls below either one! It has to saisfy BOTH conditions above 20 and 50, if one fails, you’re out.
Danny, so your entry would be if price is above both the 20 and the 50.
Your exit would trigger if price falls beneath either the 20 OR the 50?
I think my exit is set right then. It is my entry that is allowing a buy above the 20, but beneath the 50.
I’m not sure if that was doppelganger Fly, or not.
Although, that is what I like about trading with TA.
One note: a true technical analyst will tell you that “news” and “life” are already baked in to the price. Of course if news and life happen outside of market hours, it makes things a tad difficult for that argument to hold water.
correct.
entry – price above 20 AND 50 day MAs
exit – above condition is not true.
That means either one or both of the conditions is false.
Incorrect Wood. You are assuming the markets are efficient discounting mechanisms, when in fact they are not.
Fly, read carefully. I am assuming that they are sometimes efficient. I am also assuming that there are times when markets are extremely inefficient at discounting.
Really it doesn’t matter, as there are systems that can profit during times of efficient discounting, and during times when the market is inefficient. The RSI2 strategy is a good example of a strategy that profits when the market is inefficient.
You don’t have to assume the markets are efficient, only that they contain as much (or more) information in them already (readable by chart) as the much vaunted “funnymentals.”
“New” news is a monkey wrench, no matter which method you use.
___
Thanks for posting this, Wood. I get roughly the same results, whether I use intraday entries/triggers or not. All entries are initiated when the index is above both moving averages, exists when the index is below either one, so that cannot explain the radical difference in results.
WOOD:
I have to alologize for the latest posts I sent to you. I never looked at your blog roll. I use Skill Analytics a lot and saw several posts about your work. This blog is no place for me to advertise my trading software etc. What I sent you was just a way to guage your skills. I am sorry for being the biggest Fuctard on the blog last week.
Your are a true PRO and I have much respect!!!
would you add to GLD here? Oversold?
GLD, that is a very tough call. My gut says buy some, with a stop below today’s low. I would look to sell it after a 2-3 day rally in it.
BPOE, I’m not sure what you are referring to, but honestly, you can post whatever you want here, whenever you want. I want to know more about what you are using. Please, please, please do not hesitate to discuss it here. All your thoughts are much appreciated.