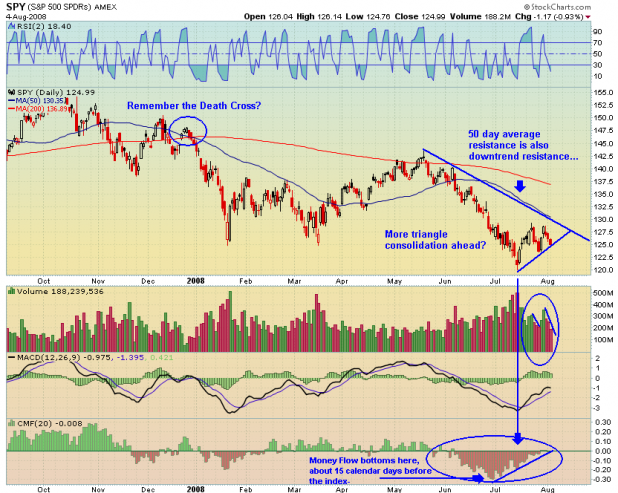
When I look at the last 11 months of downtrend on the [[SPY]] , it looks like a down trend that is not even thinking about putting in a bottom.
Notice the Death Cross, which occurred back in December. Two great posts I wrote about the event are Bulls Get Banded, and The Death Cross. Both of these posts have comments sections that are rich, with my favorite featuring the triumph of my Technical Analysis Machine over Fly’s time macheene. Its all there, from 8 months ago. Check it out.
Anyway, so yeah, the SPY is in a long downtrend, with what looks like another triangle consolidation forming. I guess the easy bet is that it breaks down from this pattern for new lows. Back in February, I wrote an article about the triangles that were forming then: Triangles Developing: Nasdaq, Dow, and SPY. Be sure to read the last paragraph of the article for yet another triumph of the Technical Analysis Machine.
In the above chart, a couple of items to note:
The volume has been higher on moves up and lower on pullbacks, since July’s low. Also, the SPY is still above a near-term uptrend line, and has not yet made a lower high, or lower low.
Also, I’ve never tested the Chaikin Money Flow, so I don’t really know if it works or not, but I’ve been sort of watching it, as it might be a good complement to the RSI indicator. Read more about Chaikin Money Flow here: Chaikin Money Flow. What amazed me about the index between December and February was that the CMF was barely negative. Of course, in June, the CMF shows the bottom falling out. Also, I want to highlight the positive divergence between the CMF and price. The CMF bottoms a couple weeks before the SPY.
I’m still leaning long. I am looking for a trip to 130.00 on the SPY, or the 50 day average before re-evaluating. The market may have other plans, and if it does break down here, I will stop out of most of my breakout positions.
I apologize for the egregious use of the bold function. What can I say? I’ve been reading too much of Alpha.
Comments »


