iBankCoin
Home / 2008

Yearly Archives: 2008

2008 Year in Review: Part 1

Really, this is all about making money trading. Therefore, Part 1 will detail my trading profits.

In Part 2 I will discuss what worked and what could have worked better. I will also discuss the changes I will make in 2009.

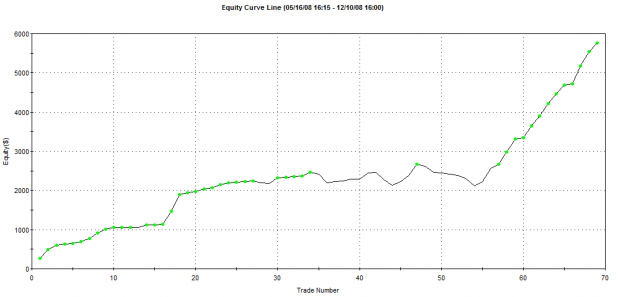
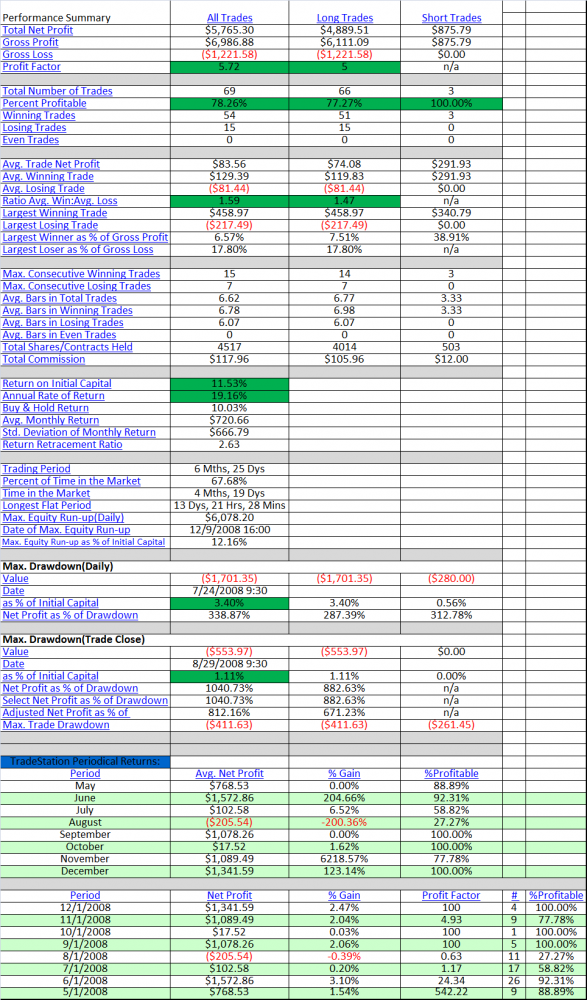
Here is a quick summary. My strategy account was up 11.53% (19.16% annualized), while my discretionary account finished flat. Combining the two accounts brings my overall gains in 2008 to 6.03%.  I’m not happy with my lackluster performance in my discretionary account, but that is more a conversation for Part 2.

I want to focus on the metrics of the strategy trades. The performance statistics are below. I find them nothing less than stellar. The metrics that I found especially appealing are highlighted in green.

Note the montly performance report. I had only one down month equaling a percentage loss of -0.39%. To be clear, the account made its first trade on May 19th, so I was down 1 out of 8 possible months, during the worst market since the Great Depression.

Feel free to leave any questions about my performance or the report in the comments section.

I want to wish a Happy and Prosperous New Year to the iBC community. I also want to issue a sincere thank you to all of the readers who have supported me over the years. 2008 has been a pivotal year for me, and it absolutely could not have happened without the blog and the readers.

Comments »
The Return of Strategy Trading

After months of dislocation, moving averages are beginning to catch up with equities. This is a good thing as most of the strategies I trade have at least one moving average as an integral component.

One of the systems that has performed reasonably well this year (46.82% annualized ROI; 56.6% win rate; .53% average net change/trade) is the Power Dip. This is a classic dip buying strategy. It is only because of sound money/risk management that this long-only system has survived the great bear of 2008.

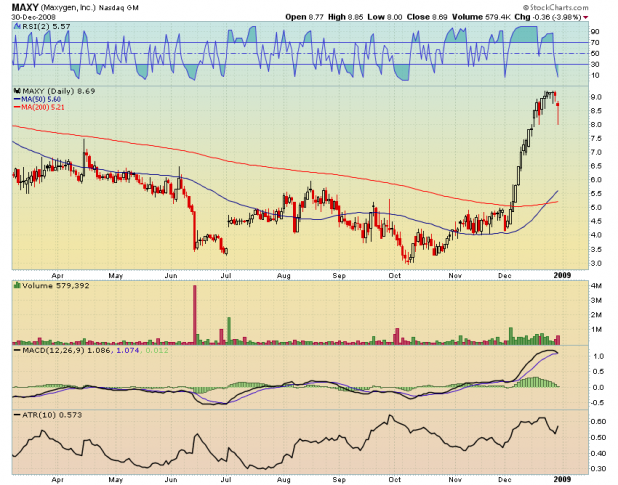
The last signal issued by the Power Dip was in late September. Today the system was very very close to giving a signal for MAXY, for a buy on tomorrow’s open. Technically, the strong close today means MAXY didn’t make the cut, but the difference between triggering the entry and not is neglible. Therefore I still like the setup.

Following the rules will require using an 8% stop with an exit the morning after an RSI2 close over 80. The stock can be held for a maximum of 3 days, and then it must be sold.

Caveat: I believe MAXY is a biotech. Beware that biotechs have an affinity for blowing off arms and legs of those who trade them.

Comments »

More MA(5): A System for Trading Volatile Periods?

Starting equity was $4,000 which was enough to buy 100 shares of the Qs on 1-5-04, the date the first trade was made.

The rules are simple. Buy 100 shares at the close if the close is below the MA(5). Sell 100 shares at the close if the close is above the MA(5). The system simultaneously opens a short position on any close above the MA(5) and closes the short position on any close beneath the MA(5). Thus, the system is invested 100% of the time, either long or short.

Money management rules: The system will add or subtract the equity from any gain or loss to the 100 share size. After a winning trade, the next trade may purchase 101 shares, or after a loss, 99 shares.  This means that the system is reinvesting profits or is trading smaller after losses. A refinement to the system would have the longs and shorts tracked separately so that as the shorts were working, their size gets larger while long sizes are decreased.

There are no stops used. I tested a time-based exit and suprisingly it worsened some drawdowns. I have not tested a percentage or volatility-based stop.

Commissions were calculated at .01/share. The report shows that commissions totaled over 25% of the starting equity.

I did not factor in slippage as I think this system may be an excellent candidate to trade with EOD funds.

Caveats: This system has performed very poorly, for many many years. While a different moving average would had eeked out some profits in the 1990s, the system did not begin performing very well until 2003. Keep in mind that this report ignores the years when it did not work very well.

My suspicion is that this system does a very good job of capturing volatility. Thus, it may have performed well during other periods of high volatility, such as the early 1970s, but I have not tested it on that period exclusively.

The Equity Curve

______________________________________________________________________________________________

The screen shot below includes the MA(5) and the longs and shorts from September to the present. The largest intraday drawdown of the system was incurred on October 10th, 2008. Note the system goes long 291 shares on September 29th. It exits on October 13th after the Qs gapped above the MA(5).

Also note that one of the most profitable shorts of the 5 year period was initiated on October 13th, after the largest trade to trade drawdown was booked.

I want to thank El Cuervo for bringing this system to our attention. I think it has the potential to develop into something that I may add to my personal system quiver. I’ll consider any suggestions for improvement in the comments section, and will test them (given enough time and assuming I can code the changes) and report back any success.

Comments »

El Cuervo’s 5 Day Moving Average Trading System

For the rules of this system, check out Cuervo’s post where he explains his Qsinator 5 Day Moving Average Trading System.

Starting equity was $5,000 with 100 shares traded each time.

I included .01 share for commission.

You’ll find my results (below) to be similar to his. My testing used the closing price of the day that price crossed above or beneath the 5 day simple moving average for entry and exit. Cuervo required the high of the day to be beneath the moving average to trigger an entry. I did not code it with that additional requirement.

I’ve circled in green the metrics that I pay the most attention to, but there are others worth reviewing such as the Profit Factor and Ratio Avg. Win:Avg. Loss. Also note that the average losing trade lasted twice as long as the average winning trade. You might be quizzed on that later.

________________________________________________________________________________________________

Below is the equity curve. Note the two large drawdowns. The first large drawdown began on 12-27-07 as the system went long twice during the January swoon. The low of this drawdown was January 23, where the system had lost 16% (intraday) from starting equity. From trade start to finish, the drawdown ended up being 9.5%

The second large drawdown began at the end of September. By October 10th, the system had lost (intraday)over 16% from the high at the end of September. However, from trade start to finish, the drawdown was only 6.5%

I believe there is a very simple refinement that could be made to decrease the drawdown. Anyone have a guess what that refinement could be?

________________________________________________________________________________________________

For fun, and because it looks cool, here are some of the recent trades the system has taken. Per El Cuervo’s rules, the system only traded 100 shares at a time. On the chart below, MA5LE = Long Entry while MA5LX = Long Exit.

A very simple yet profitable system. I wonder what percentage of retail traders were able to beat this system in 2008?

Caveat: Testing over all the data for the Qs (starts March 1999), the system hit a high in March of 2000 that was not surpassed until August 2008.

Comments »

Evening Screen Results: 9 Charts

Every evening I check my strategies for signals to be placed at the next open. There haven’t been very many signals lately as almost all of the strategies have as one component some form or another of a moving average.

If there are no strategies, then I run some more scans. The following are some charts I like from a variety of scans. Most of these came from a momo scan. Thus, they should be bought after a pullback.

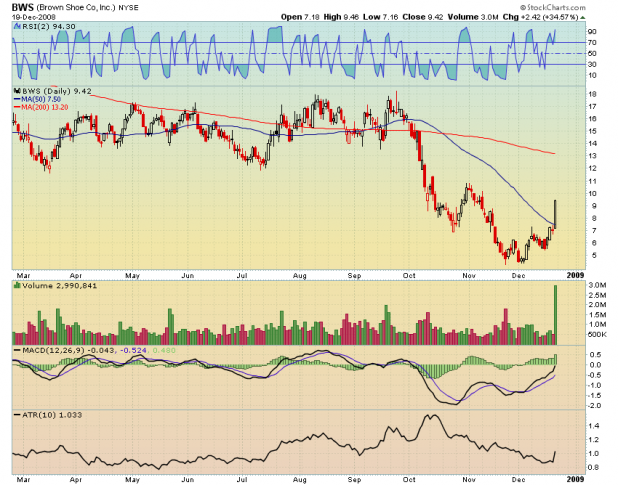
BWS had a nice move above the 50 day average on huge volume. Could be a long candidate, or possibly a short candidate, depending on the reason for the surge in volume.

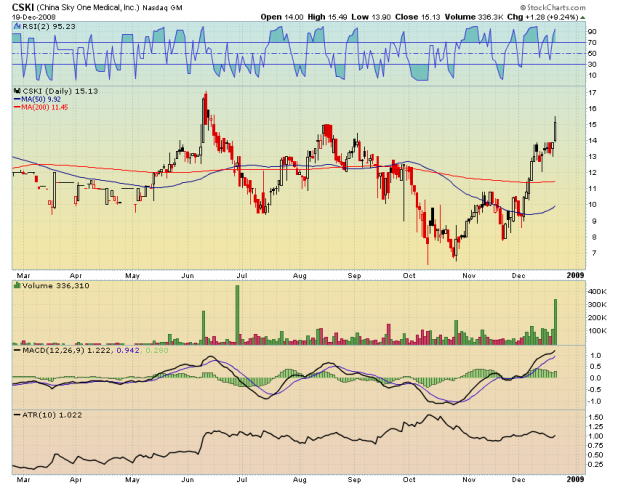
CSKI Nice breakout move. I would like to see volume begin to average over 300K. I have no idea what is driving this one forward.

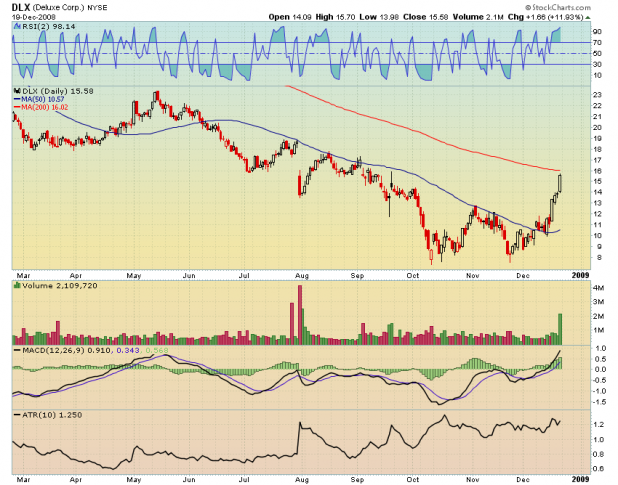
DLX- This one I’m placing into the short candidates. The surge in volume is encouraging, but 200 day resistance is just overhead. Also, it has doubled in less than a month.

Should Deluxe Corp. (cool name) begin to flag here, on declining volume, it may actually make a good long candidate.

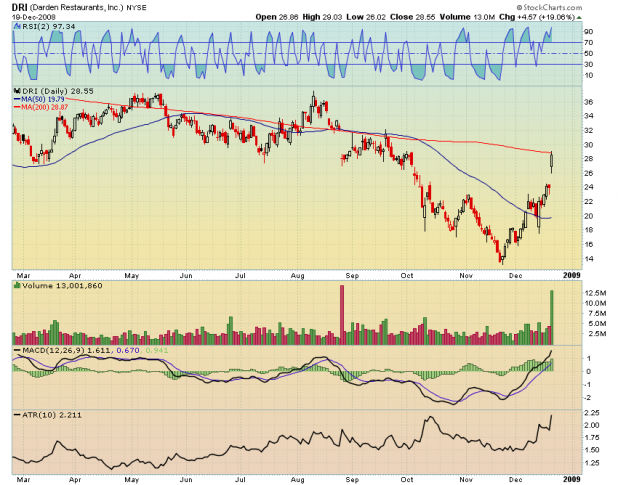
DRI- I have this one as a short candidate. I have no idea why the volume surged. Looks like a lot of resistance overhead.

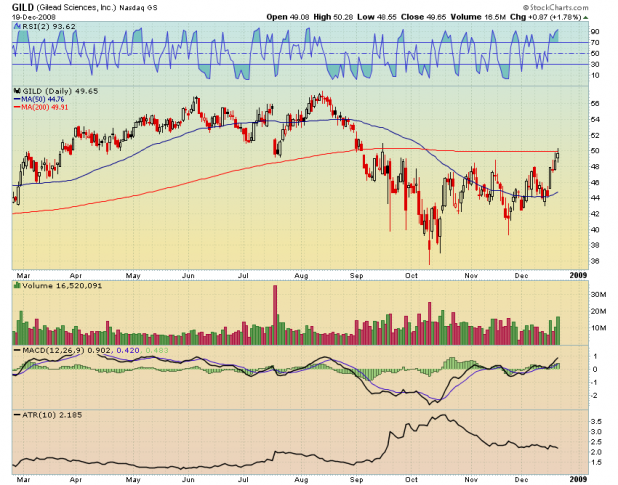
GILD Could be a nice cup forming, or the 200 day may halt the advance, until it tries again.

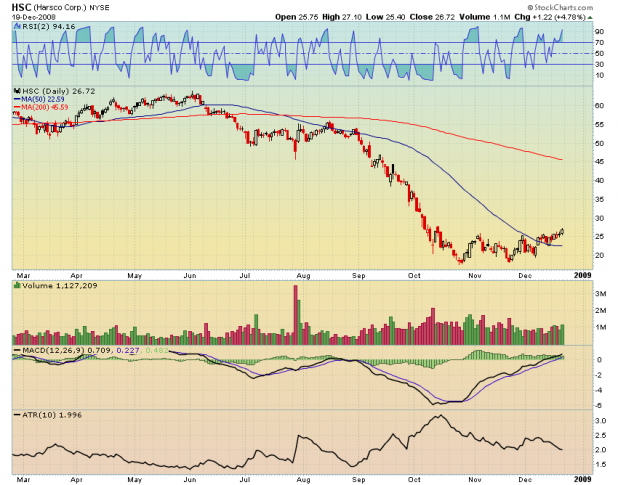
I have no idea what HSC is or does. However, the chart has a beautiful rounded bottom forming, with volume increasing in all the right places.

I had to go and check out a little about this company. Here is the yahoo blurb: Harsco Corporation provides industrial services and engineered products primarily to steel, construction, railways, and energy industries worldwide.

Maybe HSC is a play on the Obama infrastructure plan.

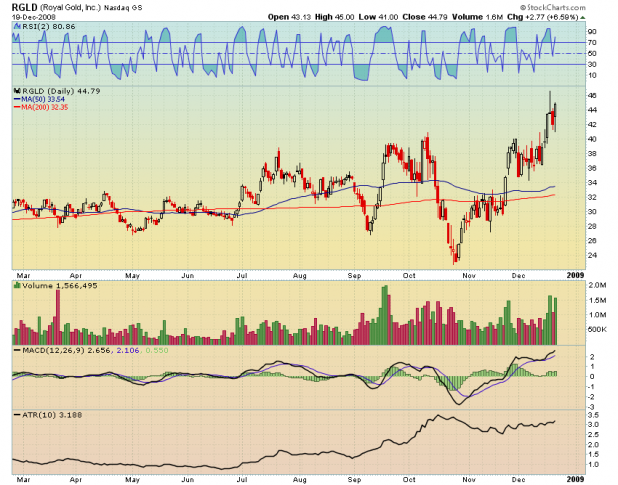
RGLD: Who doesn’t love a gold stock making new 52 week highs?

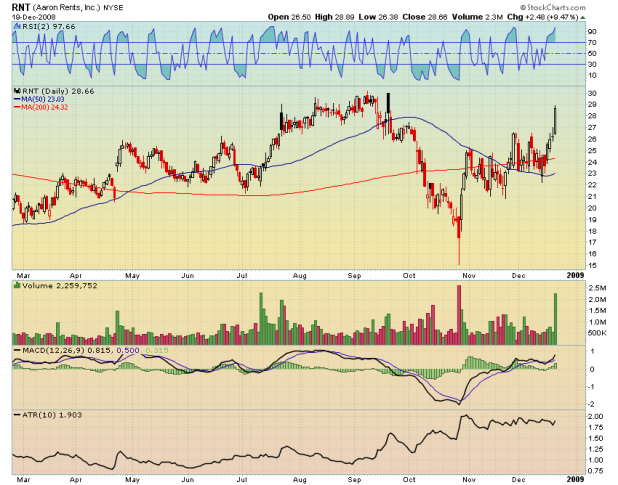
Nice pattern forming in RNT. I would like to get a small position here after a pullback. The position would be in anticipation of a breakout.

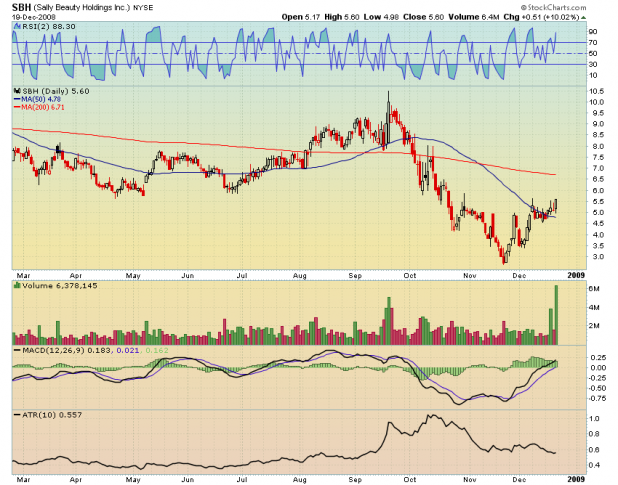
SBH has another beautiful bottom forming, with volume in all the right places. A run to $6.50 would make a 15% move from Friday’s close.

CAVEAT: Do yourself a favor and investigate the surges in volume before buying/selling any of these companies. It would not be fun to get short a company in front of buyout rumors.

Comments »

Do People Have Less Sex During a Recession?

This stock was identified by another short system. This system is not one of my favorites. I might even call it mediocre. In fact, I rarely take signals from it; instead I’ve just been tracking it and making occasional tweaks to the stop percentage, exit criteria, and max days to hold.

Here are the statistics over the last year:

Trade Statistics
There were 185 total stocks entered. Of those, 182 or 98.38% were complete and 3 or 1.62% were open.
Of the 182 completed trades, 102 trades or 56.04%resulted in a net gain.
Your average net change for completed trades was: 1.16%.
The average draw down of your approach was: -5.39%.
The average max profit of your approach was: 5.87%
The Reward/Risk ratio for this approach is: 1.44
Annualized Return on Investment (ROI): 58.94%, the ROI of ^SPX was: -37.85%.
Exit Statistics
Stop Loss was triggered 53 times or 29.12% of the time.
Stop Profit was triggered 0 times or 0.00% of the time.
Trailing Stop Loss was triggered 0 times or 0.00% of the time.
You held for the maximum period of time (10 days) 22 times or 12.09% of the time.
An exit trigger was executed 107 times or 58.79% of the time.

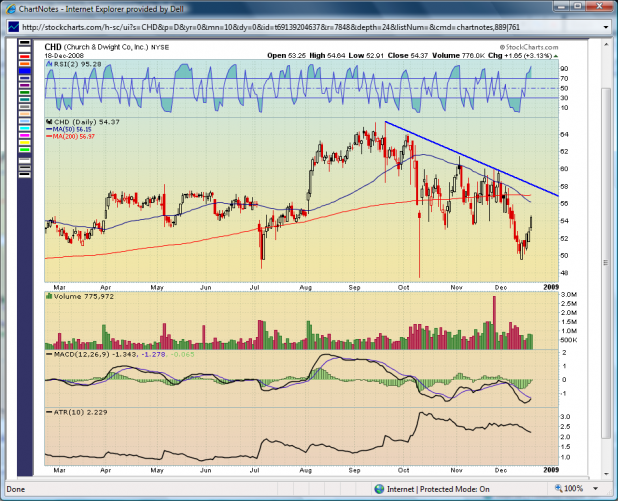
I like several things about the chart, in terms of a short setup. However, the system win ratio of 56% is low, at least for a system with a short time horizon. Caution is therefore advised.

Since the system is profitable, it may be that the entry signal produces an edge that is barely better than 50/50 while the money management and exit strategy make up the difference.

The system was backtested with a stop of 8%. Should I take the trade, I will likely use a 1.5ATR stop, which would place the stop very close to 58. Not only will that give the trade room to move, it also gets the stop just above multiple areas of resistance. I do not want to be short CHD if it can break through multiple areas of resistance.

In case you didn’t know, CHD manufactures and markets of Trojan brand condoms, as well as other household products such as Arm & Hammer baking soda.

Comments »

Poker Night

$40 buy-in. Top three take home money. Pot should be around $1000.00

That’s where I’ll be this evening.

I say this because I didn’t want folks to think I would miss this opportunity to remind them of who was bullish around here (myself and Jake Gint).

If I had time, I’d link to prior posts over the past several weeks where I made statements such as

  • Begin building small, starter positions will loose stops
  • Don’t be scared with an initial failure at the 50 day average…keep positions small
  • The indexes appear that they need a larger pullback before regaining the 50 day average
  • Stay long unless the new uptrend started from the November lows is broken

Wish me luck tonight!

Comments »