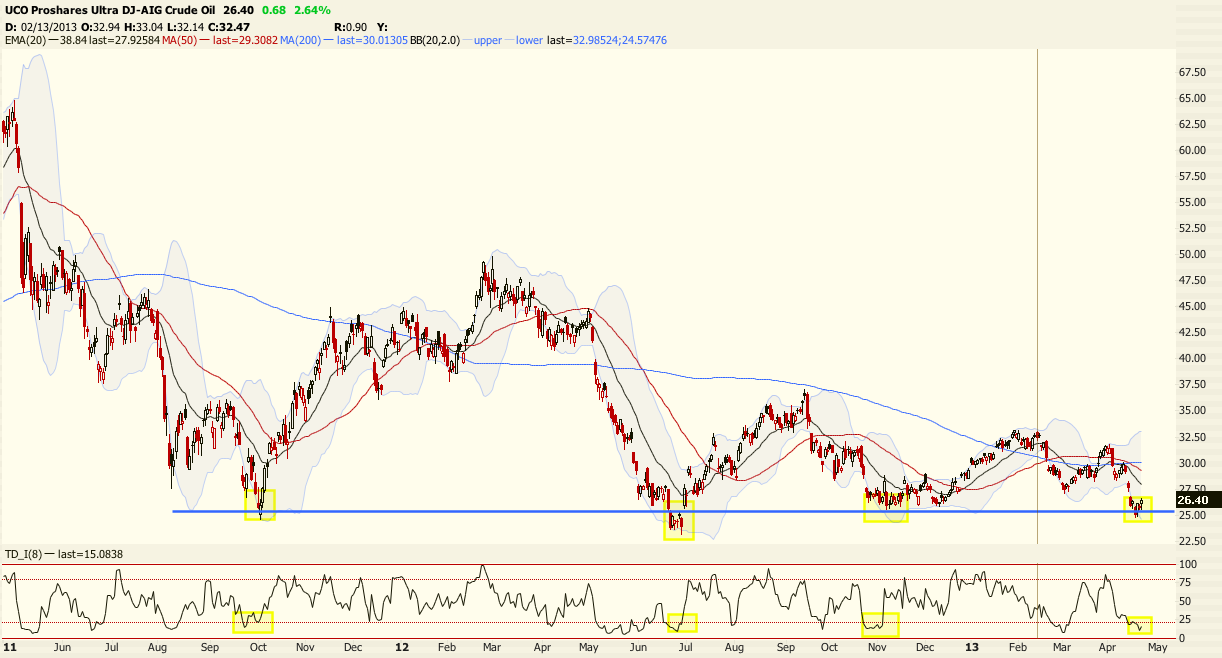
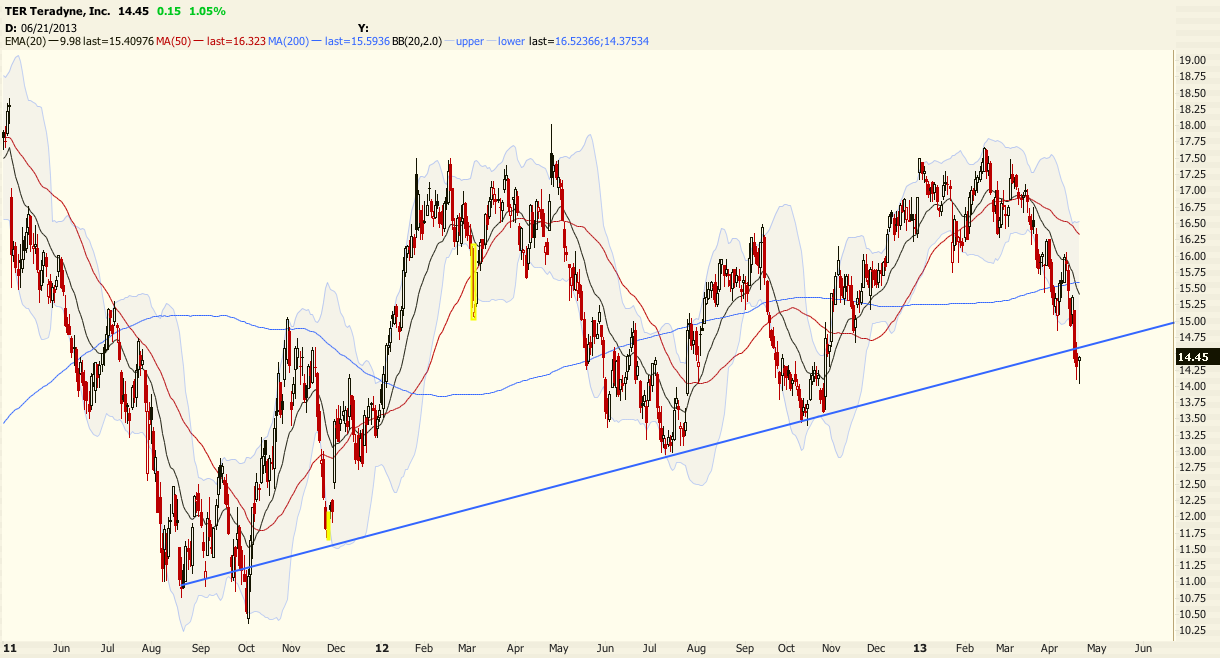
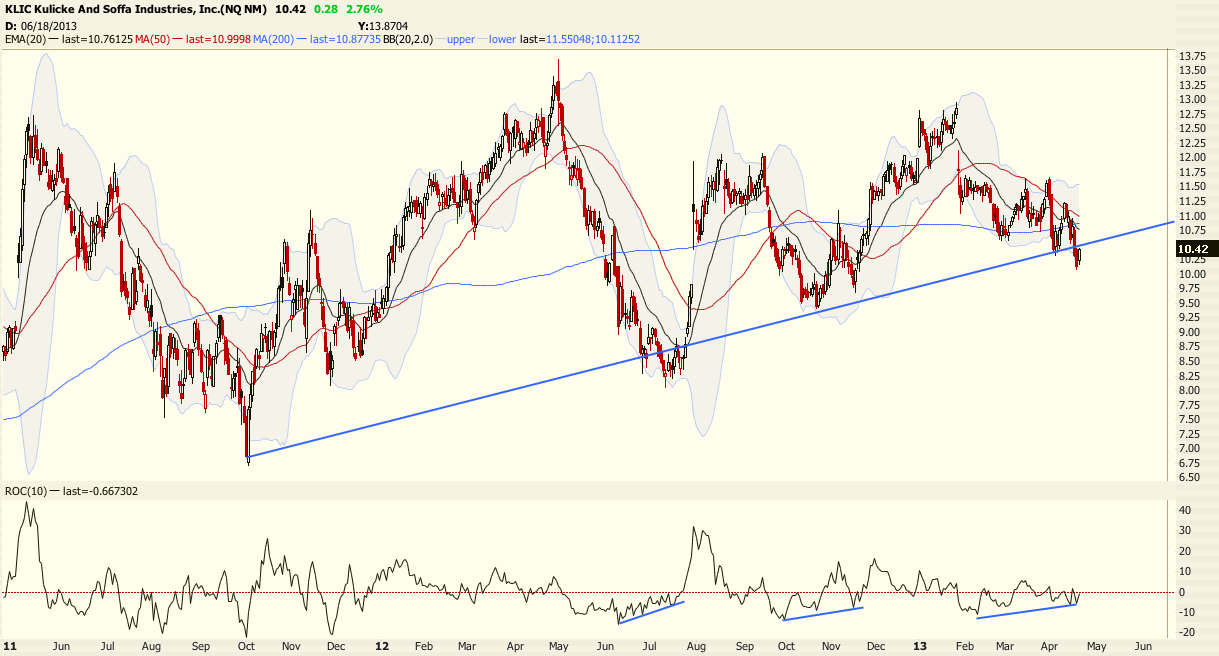
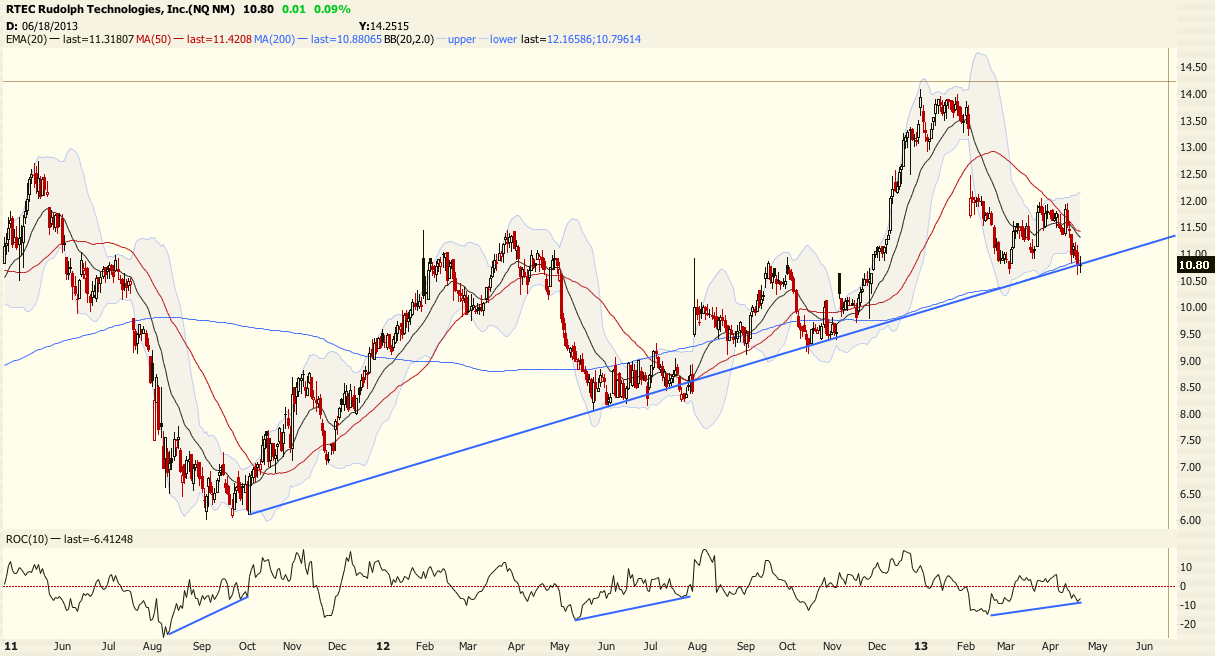
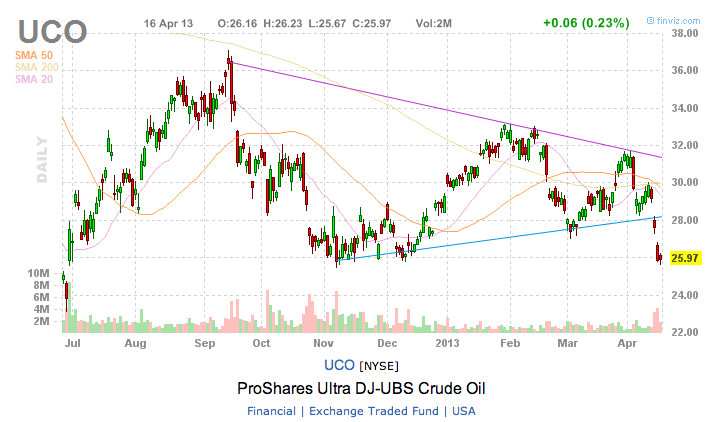
My portfolio has recovered from a significant drawdown the past few days. I’m up about 7% from the start of this week but my high water mark is still in the clouds. I was surprised to see almost all of my positions contributing to this. I sold my UCO position for a 10% gain. It was a nice, clean trade that I outlined on this blog. It will most likely continue higher, but I needed to raise cash. My current cash levels are now 15%. My favorite positions right now are KLIC and RTEC. Meanwhile, my OCLR position is finally setting up as a technical trade that should pop tomorrow. My positions and charts are here on Finviz.
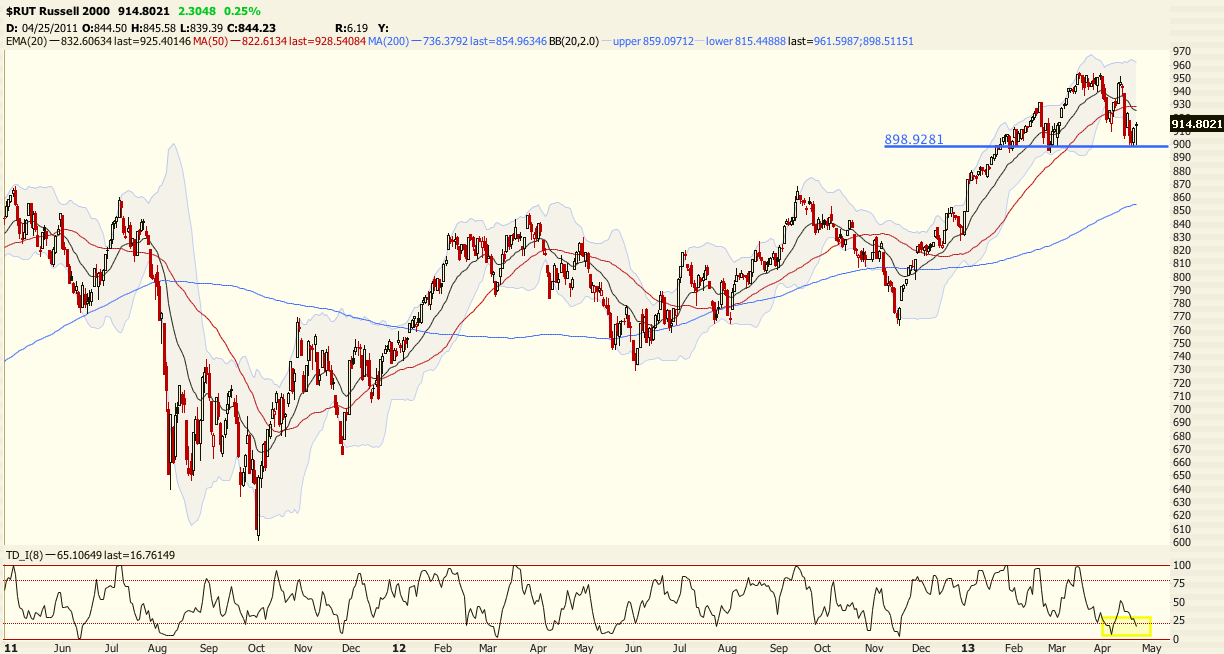
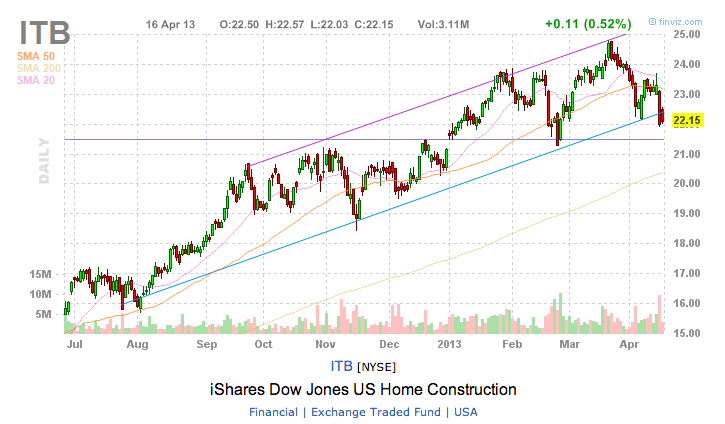
It feels good to rally back up after a big performance drop, but that’s when traders (myself at least) are most vulnerable. The seasonality should be respected here as the floor can literally drop out from under us. The crystal ball in my last post indicates a head and shoulder top brought to you by the Russell and homebuilders/construction sector. Should we scream higher tomorrow, I think that the crystal ball should be broken into a million pieces.
A few members in The PPT have been focusing on stocks with a low float, and a high short float percentage. I love those plays, and a lot of them are working well right now. One example is MEG, displayed below.
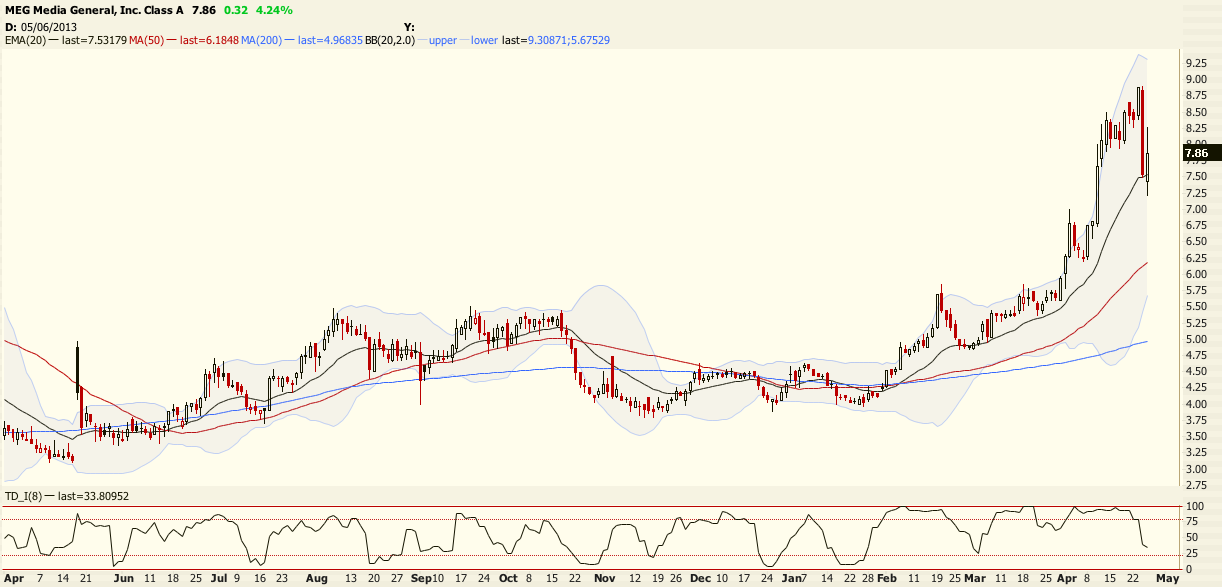
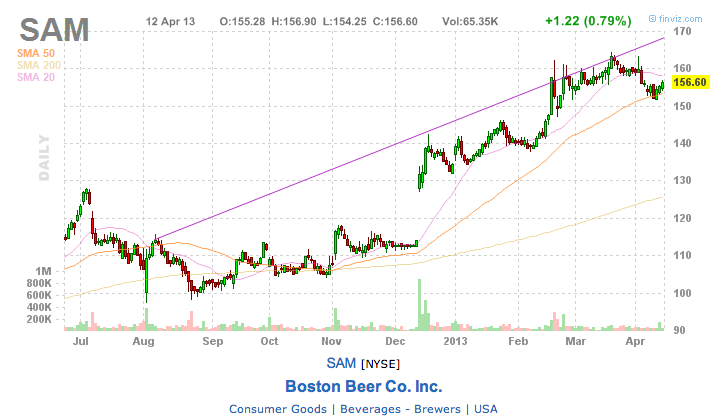
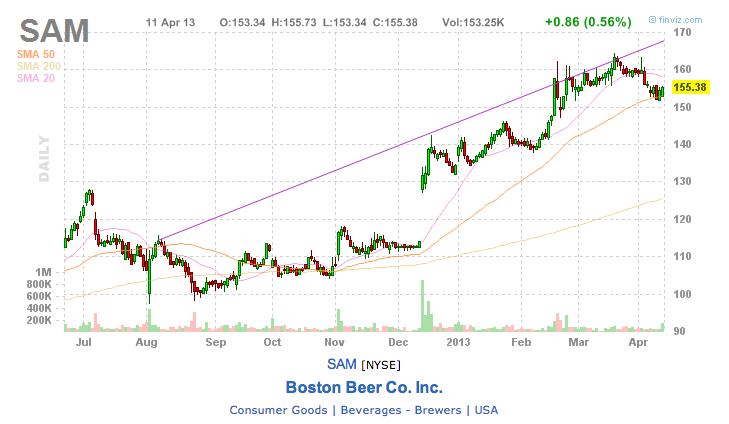
MEG has a 40% short float. The shorts quickly capitalized on the 15% drop yesterday, as seen by the price action in today’s session. Once these get moving, they are literally explosive. The shorts must cover into an illiquid tape, and the buy pressure lifts the stock. Another name I have been talking about on this blog is SAM. The beast continues to squeeze shorts as it hits new highs.
Note: Look at GTAT. The cup and handle looks ready to rip higher. Sapphire is hot, the Fly was all over it.