Glancing through my portfolio of 8 stocks, I’m beginning to wonder how I constructed such a composition of holdings. Of the 8 stocks, 3 are centered around the industry of semiconductors. The names are KLIC, RTEC, and OCLR. KLIC and OCLR are classified under Semiconductors and Equipment, whereas RTEC is categorized as a Scientific Instruments company. Between the three names, I have 25% of my portfolio invested in them.
These were never intended to become holdings, as I would have never thought to own them at the beginning of the year (housing is my favorite theme). The industry is rather dry in my opinion. However, their fundamentals dragged me in as they have continued to underperform the indices and other stocks. As a result, I made purchases during the downtrend. Turns in the trend looked promising, but they failed time and time again.
For the sake of the post length and our time, I’m just going to talk about KLIC here. The company is announcing earnings on April 30th. From a fundamental perspective, the company looks awesome because of their balance sheet. They just paid off their notes, and thus have zero debt. Also, the market currently values it at low multiples. Their PEG ratio is low at 0.38, and their PE ratio is low at about 5.
Reading through their SEC filings, I found nothing that looked too worrisome. The only major risk that I see is the limited customer base. If a customer decides to drop them for whatever reason, then they could suffer material drawdowns with respect to earnings. However, I think that this company is capable of retaining customers, and possibly obtaining more. Their innovation with respect to cutting gold loose and bringing in copper has brought them to the forefront of their industry. With a clean balance sheet, they can also invest in research and development for their future. They also have exposure to the LED industry, which I think will continue to grow.
Hopefully I’m not being value trapped here with the technicals looking pretty grim. The fundamentals are my excuse for failing to get out of the name already.
I reviewed the charts of others within the industry with the same fundamentals, and found that the S&P 5oo stock TER trades with a very tight correlation to KLIC. Thus, I have provided the TER chart below. It’s at a critical point in terms of price. 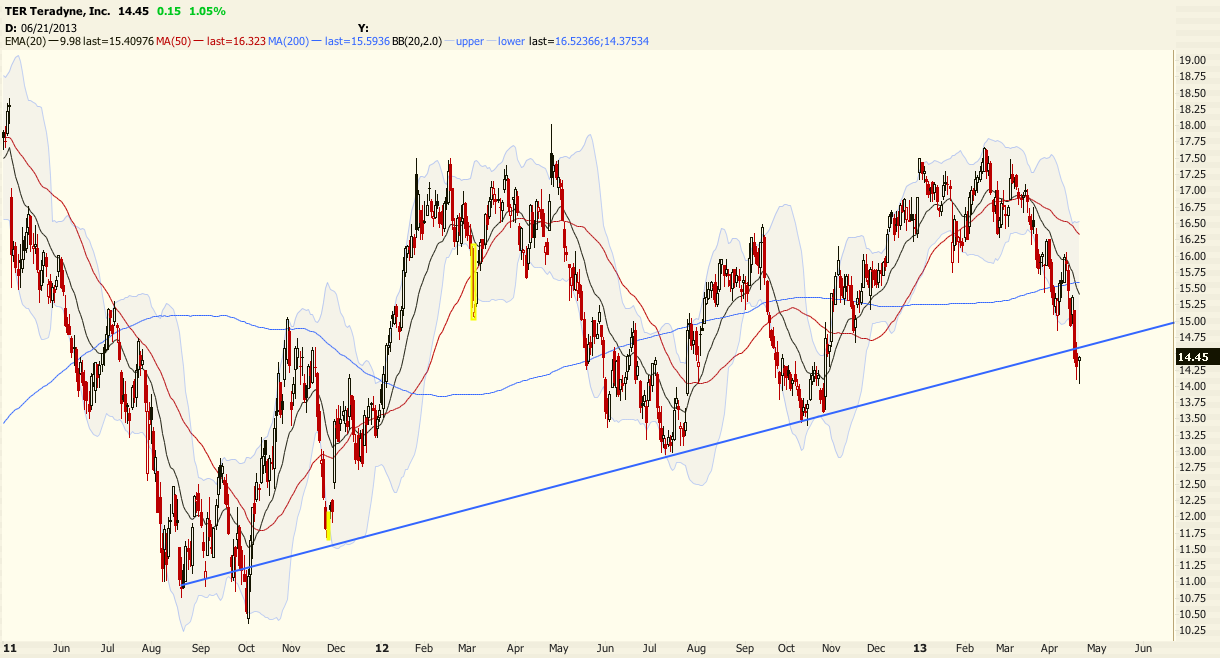
The two year trendline of TER is being tested, and the hammer action we have been seeing in the name during the last two sessions makes the case for a possible reversal.
Now, for KLIC, the trendline isn’t as pristine, but it’s there. But I would like to point out the divergence occuring near it.
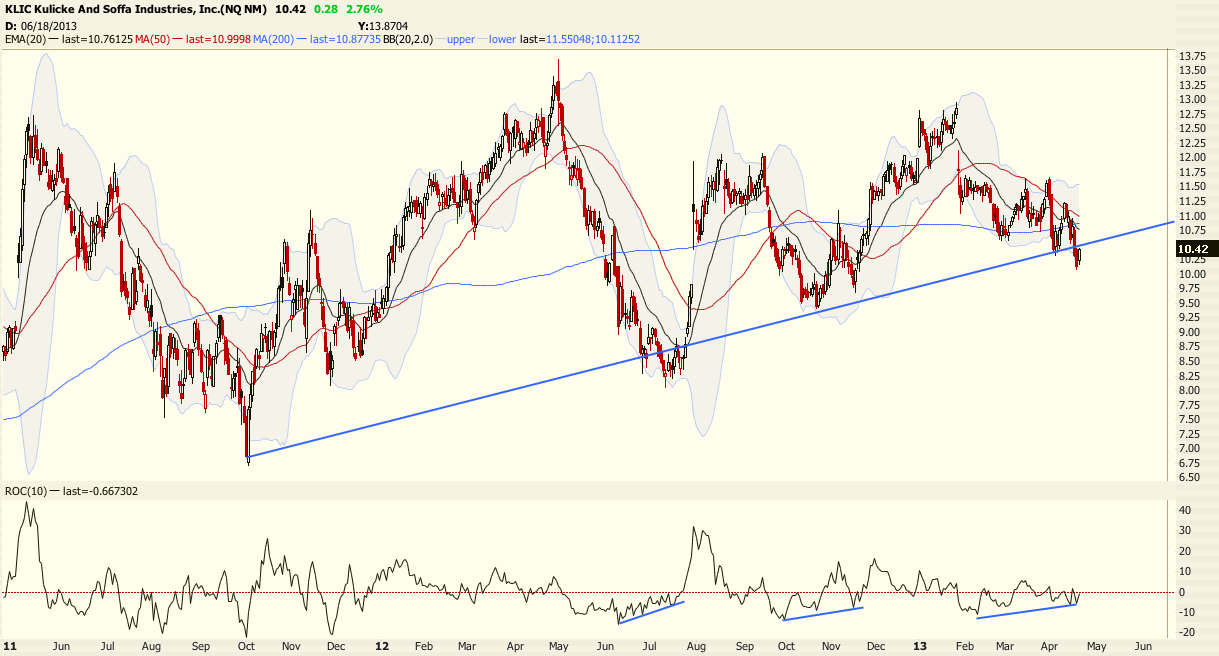
I have also included a rate of change oscillator at the bottom. It has a good recent history of calling local tops and bottoms. There is a clear divergence currently occurring as it comes to terms with the trendline.
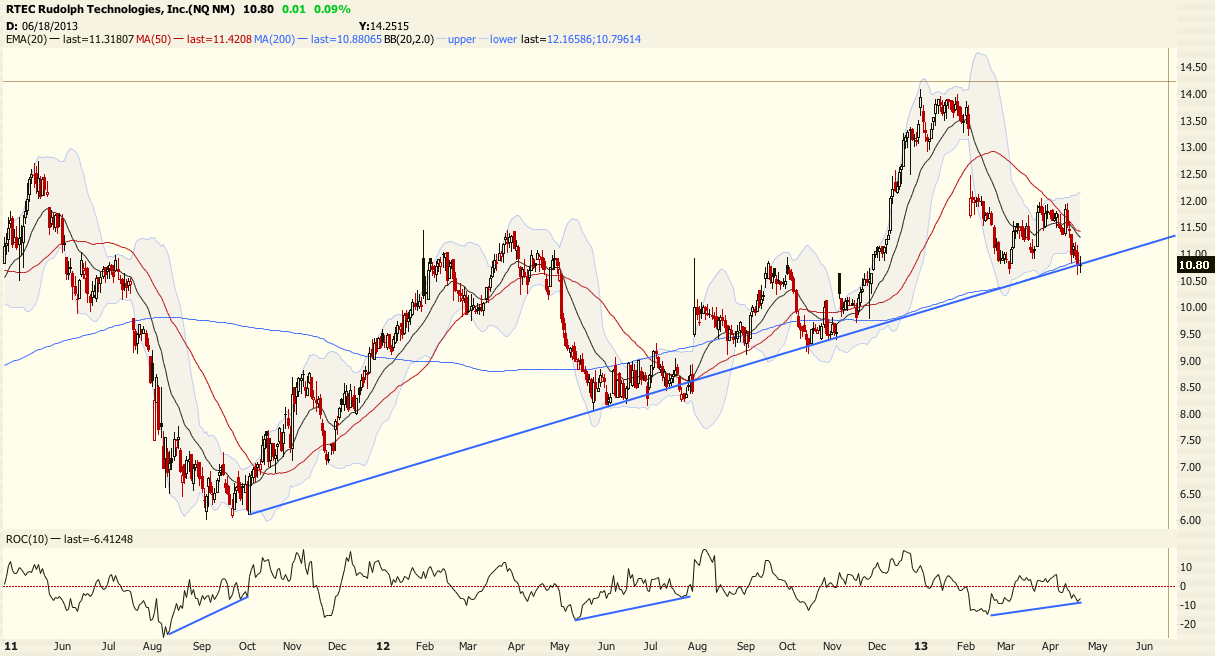
While I’m posting charts about 2 year trendlines, I might as well include RTEC. It’s currently hitting the trendline with a divergence as well. The chart is below.
These charts give me some hope to holding my positions. Even if they break technicals, I still might end up not being able to hit the sell button.