I haven’t posted anything in awhile due to other obligations. I have been in and out of the market, but as of the last trading session I am fully invested. This wasn’t the plan, it just worked out like this because of my large investment in USG. My current book consists of the following stocks in order of position size: USG, KLIC, IMUC, WNC, RTEC, CALL, DANG, and VHC. The charts can be found at Finviz here.
I really wanted to be out of USG at the higher prices, preferably when the Fly exited. However, that didn’t happen because some people started talking about wallboard prices decreasing. The stock instantly dropped and the shares have continued to languish over the past week. I truly believe in the long term story on housing and that is why I have decided to stick with this play and not sell for a small loss. Investors are going to continue buying up housing related stocks when they dip, and USG is no different from the rest. The shorts in the stock will be pummeled in the years to come.
As the S&P 500 hit new highs on Thursday, I added three new plays to my book to bring me back to nearly 0% cash. I am going balls to the wall here. Hopefully it’s not a mistake. The three stocks I added were KLIC, RTEC, and DANG. I added the first two stocks for fundamentals with technical reasons, and I added the chinese burrito for shits and giggles.

KLIC is setting up for some gains here. By the end of this year I would like to see it trading around 16 bucks a share. The price relative to all of its fundamentals is outstanding. It is liquid as hell with no debt. I don’t mind parking some cash here for awhile to realize these gains. I am just trying to perfect my timing through employing the technical/geometrical set up, the trade is not solely based on this. As of Thursday, the stock is also in the top 10 of The PPT.
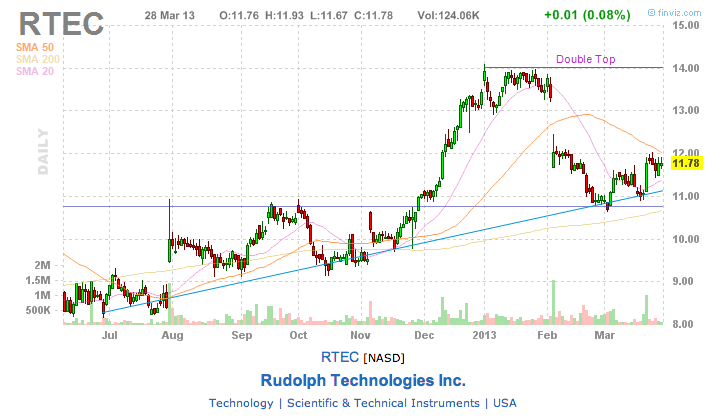
RTEC caught my eye last week when it was in the top 10 of The PPT. I liked it because it was not yet extended, yet it was still producing a high hybrid score. I am in this one purely for growth. It has had a 1 year EPS growth rate of over 70%, blowing its peers and industry out of the water.

DANG is my smallest position next to the lame stock of VHC. I bought it for pure technicals and as a gamble. I hate buying chinese stocks due to the fraud and this is the first one I have purchased in awhile. The declining trendline appears like it is being tested. The bottom action screams coiling/compression, and the bulls may be able to charge through the resistance. My goal here is to trade it to the 200MA and make a quick exit, if I am ever so fortunate.
I am willing to shuffle some of my positions and swap out some stocks. I would rather hedge myself with some shorts to limit my overall exposure, but I might just be stupid enough to go in on margin here with some new longs. If my CALL or WNC positions have any meaningful moves this week, then I would be happy to finance new trades with the proceeds.
My next ideas are to include: GFA, DDD, and AKAM.
Good luck trading everyone, and enjoy the new highs while they are here.