I was cruising the charts on each of my positions, looking at the bigger pictures (past three years) and their volume profiles. When applied to the longer term periods on a chart, a volume profile analysis can help you see where the supply levels of a particular stock are, and subsequently it can lead into discussions on future movements in price. One of the previous tabbed bloggers, ElizaMae, has done a lot of work on this, so I encourage you to read over his blog.
I found that IMUC is at a critical point, both technically and in terms of volume profile analysis, so I will go ahead and discuss this stock.
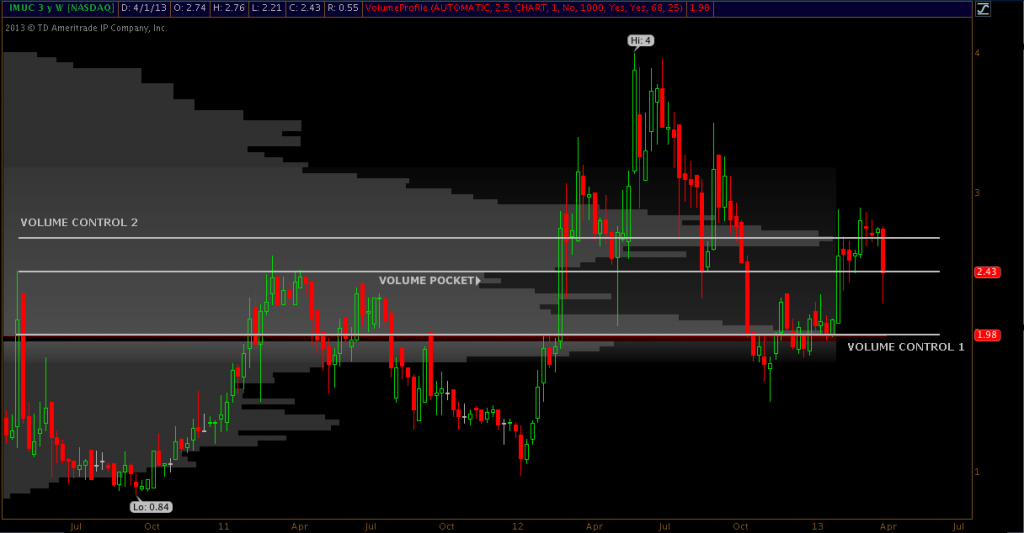
Here is the three year chart of IMUC with the volume profile.
I marked three critical price levels, the highest line is at 2.68, the midline is at 2.43, and the last line (the true point of control) is at 1.98.
So what do I make of all of these levels? Well, look at the 2.68 price level, and the 1.98 level. Those two prices have proven to be the most active areas of trading for IMUC, and that’s why I have labeled them both as points of control or value. Between these two points, there is a relative lack of volume, and that is known as a volume pocket. Price typically moves through these voids very quickly because of the lack of supply. Thus, it can be a bearish indicator when approached from the top (selling pressure), or a bullish indicator when entering from the bottom (buying pressure). Right now, IMUC appears to be entering this volume pocket between its points of control from the top. This is BEARISH, and quite frankly, something I do not want to see.
However, I have added an additional price level that has been an area of technical importance for the stock, the 2.43 level. The price level hits the previous peaks dating back to 2010, and served as the neckline for the head and shoulders top that formed in 2012. Furthermore, the price has also had some volume significance, as the true void significantly opens below this price. It’s as if the price were the ground before a cliff, so to speak. IMUC closed right at this level last week. On a weekly scale, if it crosses this line in the sand, then things can get ugly and price may very well hit the 1.98 point of control. If it holds, then I think the price may appreciate back to the 2.68 region. The action this week should be exciting.
Keep in mind, the volume analysis is a rather dynamic indicator, as the void could eventually become a point of control if the greater amount of volume in the market values IMUC at that price. I would also wait until the end of the week to judge the behavior around the pocket (price may enter the void, and then bid back up by the end of the week).


