Portfolio Update

157 views

I sold KLIC today for a slight gain. I will look to add back should the market conditions warrant. Other than that, my portfolio is unchanged. The past two days, both USG and SLCA have been ripping. I think that SLCA will head higher with time, my write up on it can be found here. If everything hits my targets, I will be holding two core positions by this week’s end: SLCA and WNC. I have a few speculative plays in the pipeline that should do well in this stage of the market. Check out ODP. I was stern on holding my ground, but the thought of cash is making me feel more comfortable. I was down huge last month and my stocks rallied back into the black on my books. I cannot be greedy.

My current charts and positions can be found here on FInviz.

Picking Trades

303 views

The next five sessions should be interesting for all individuals currently in the market. If the long awaited May correction is to take place, then I think that the bears will have to sink their teeth into the bulls this week. Being that I have hardly any cash on the books, it is obvious that I am unprepared for any potential sell-off that lies ahead. However, I am not going to alter my exposure or positions. I trade what I know and what I see, not what I fear or anticipate.

When my trades are not entirely based on technical analysis (like BV), they are typically generated from a fundamental idea or thesis. I then research the company extensively, looking through the SEC filings, analyst reports, and other accounting metrics to establish a sense of direction for the business. I think to myself about the current economics surrounding the industry, and then I decide if fundamentals suggest an entry into the trade. The charts then follow. Technical timing is key, and it provides a trader with a possible leg up when it comes to getting the right price. I am a firm believer in support/resistance and price history. My favorite indicator is the volume profile. Knowing where most shares have traded gives an insight into the accumulation of shares at certain price levels. It allows a trader to see where the market values the company, which is always different than financially based valuations. If the fundamentals and technicals line up, I then place my order. This is not some bullet proof method of course, as technical analysis can lead to results that are opposite of what is anticipated. Meanwhile, fundamental theses can blow up before your eyes. It is all about the edge it provides. We know we will all fail occasionally, but the better your filter, the higher your win percentage will be over time. That is my theory, anyway.

I am looking for my technical BV to trade up to 8.00 this week, and I will look to sell there if it cannot break through with volume or strength. To be honest, I am quite satisfied with my all of my positions from a technical standpoint. My current positions and charts can be found here on Finviz. Each position looks like it is at an actionable point, especially USG and VHC. Time will tell.

I have a couple of other fundamental trades in mind, and I am currently delving into the companies in my spare time. I plan to have a couple of write  ups by mid-week. I have more cash flowing into my brokerage account, as these said companies are going to be my summer plays. I think you will find them more interesting than silica sand.

I will leave you with two chart ideas: TGA and HMA.


A Case for US Silica

559 views

I started a 10% position in US Silica (SLCA) today. I managed to pick some shares up on the lows to benefit from a nice gain by the close of the market. However, I am hoping that it does not run away from me in the short term because I am willing to stuff my cash from other names into this company. The PPT is suggesting a short term rip higher may be in the works, as it was oversold on the 3 month time frame after yesterday’s session.

I found the company after reviewing the Fly’s GARP watchlist. They sport a quarterly revenue growth of 20% and a low PEG multiple of .30. The revenue growth should be expected due to the known boom in the demand for proppants used in horizontal drilling, and the low PEG multiple represents the hesitations surrounding the industry as a whole. Is growth tapering off? Is supply meeting demand? Isn’t fracking terrible for the environment? Going forward, I think that we should go with the trend. Fracking is going to continue whether you have environmental reservations about it or not. Oil and gas will have their way in the long run, and if you want to bet against that, then you are going to lose money. Volts, Leafs, and Teslas are not going to flood America overnight. Oil needs to be accessed, and the use of silica to obtain it will grow through the course of time. Coupling that with a potential bottoming in natural gas, the industry becomes much more appealing.

Within this industry, transportation costs lead to the fragmented isolation of markets. Silica sand is far too bulky and heavy to transport without paying a high fee. Subsequently, this results in barriers to entry. Pricing then boils down to who is the closest to the specific job site, and how much they can supply. Due to this, a lot of smaller guys will pop up and attempt to take their stake in a small market. US Silica recently partnered with BNSF to transport their products via rail. Through this, the company has greater access to markets and can actively compete in a manner that the smaller guys cannot afford to. While there are claims that frac sand supply is meeting demand (if they are true), I do not think that this will have an immediate effect on the company itself. Growth can be found through increasing its customer base through the utilization of rail. Sure, they cannot have every market, but why not grab the largest share that you can?

US Silica operates in two different business segments: the oil and gas proppant space and the industrial/specialized product space. Compared to the prior year, the company’s oil and gas proppant sales grew by an impressive 37%, whereas the industrial/specialized sales were hardly changed. Viewed together, that is an increase of 19.7%. The benefit of the dichotomy is the inherent diversification. The uses of silica sand are still being realized, and thus I would not discount the ability of the the industrial/specialized segment to grow in the long term.

The reason I started a position was because of the recent pull back from the highs of the stock price. I think that this would be a good time to add, and it is worth noting that most shares have traded right at this level. This suggests that fair value, from a volume perspective, is right upon us. Depending upon the price action, I am willing to increase this position size to 20% of my assets. I think the price can rise to about $26 a share if the market sentiment becomes bullish again.

A competitor to note is HCLP, which pays a 10% dividend. The company suffered a drawdown in its share price after losing its largest customer. It has since recovered. I think that US Silica is safer in that regard, as they have managed to maintain longer term contracts with their biggest buyers. Prices in these contracts are set at a fixed rate, and are adjusted should transportation costs warrant. I know this is a rather brief write up as to why I am so bullish. I have more reasons, just not enough time to pen them. I will try to follow up with more work on this name as time goes on.

A little Background about Myself

627 views

I started writing blogs within the iBankCoin Blogger Network in February. Since then, I have written about 30 posts. That pales in comparison to others on this site. I have enjoyed writing and posting ideas, and I know a couple people out there are listening (shout out to Vertigo). Most of these posts are written to generate ideas, but more importantly they serve as a journal for myself. Blogging my thoughts and making them presentable to you guys helps me out a lot, and I don’t think it hurts you at all. I think I should share some background as to who I am, without revealing too much at the same time. Anonymity seems to be the theme on this site, so I will stick with my funky rapper name of Tpain.

I am an undergraduate Economics student at a top university. Since trading isn’t taught in textbooks, I decided to venture into the investment world on my own. I have experience day trading from working with a proprietary firm, but I have since moved on because scalping the market became frustrating. Finding setups that would break out or down based entirely on chart patterns became too time consuming, and using the firms capital started to stress me out. I didn’t like someone telling me to sell my shares or cover my short when it was working. I had some cash so I thought to myself, why not do this on my own? I developed a trading style that is a mix of swing trading and position trading (very similar to most on this site), and so far it has been working. I take enjoyment in developing a thesis for a trade. Sifting through annual and quarter reports to find anomalies is fun to me. I hope that doesn’t sound sick or something. Overall, I have only 3 years of experience in active, real money trading. I have been interested in stocks since I was 15 and always paper traded while sitting in my high school classes. So far I have made some decent returns, and family members and friends are now asking me to manage their accounts. I don’t know if that’s a good thing or a bad thing…I feel that I need to prove myself more in order to trust myself with other peoples money. With that being said, I have accepted a few due to pressure.

Okay, so that’s my background as it pertains to trading. Maybe as time goes on you guys can read about my “interesting” life.

Undervalued Wanting Higher

224 views

I have a screen in The PPT that scans for stocks based upon their 6 month return, book value, and earnings/revenue growth. About a month ago I posted some suggestions from the screen. This is to simply remind you of them. The charts and tickers are here on FINVIZ.

As a brief update, I sold OCLR  at 1.10 for a nice 20% loss. Never hold through earnings…


My Plans for the Rest of this Week

320 views

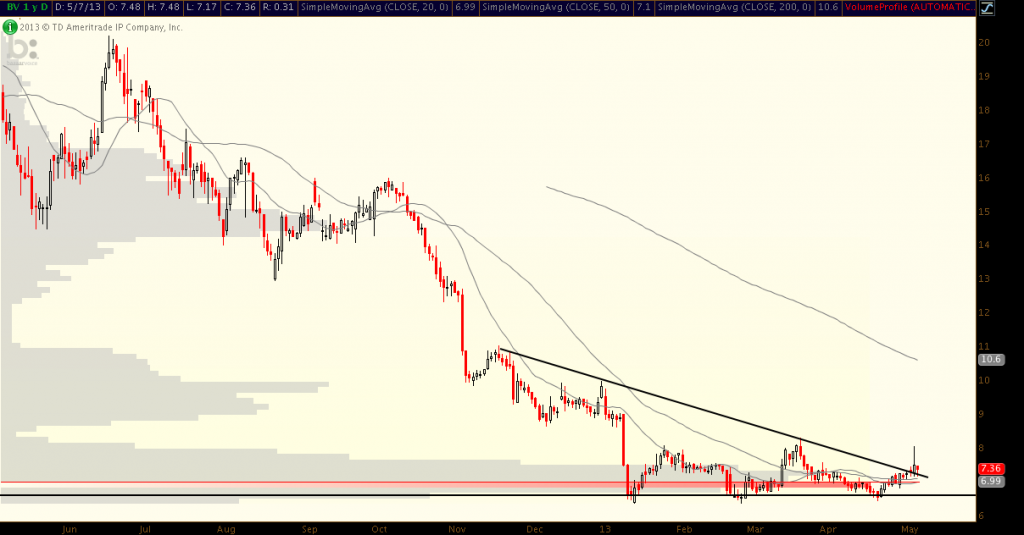
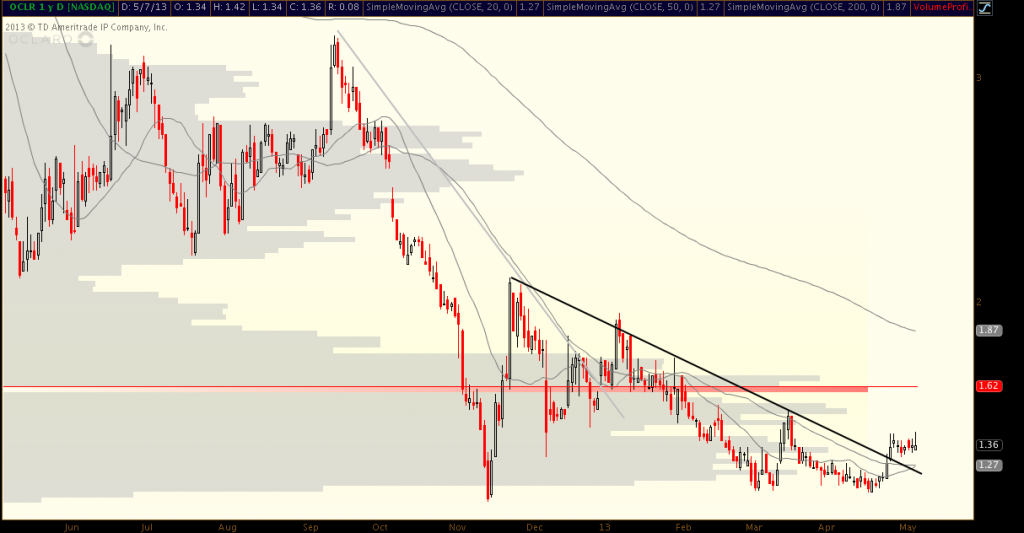
The only variable positions in my portfolio are those that I initiate through technical analysis. Certain geometrical patterns appeal to my gambling mind, and when they pop up I tend to throw some money at them. For instance, look at BV and OCLR. I have no reason to own these stocks for any fundamental reasons, for they are absolute garbage by my standards. Is there a pipeline in the works between either of the companies for a strong thesis trade? No. Look at the charts below.

Screen shot 2013-05-07 at 10.54.09 PM Screen shot 2013-05-07 at 10.53.48 PM


The key here is position sizes. Both of these patterns rely on the break of descending trendline, which often can fail if there is an overall bearish sentiment for the stock. The risk/reward is high. I never allocate more than 10% for a position like these. In this case, BV is sitting right at 10%, and OCLR is just below 5%. I am fairly confident with BV due to the high short float and the rather recent IPO. However, I have made a very bad mistake with OCLR. I held through earnings. The earnings report was awful, and as a result, their stock is set to drop by 20% tomorrow morning. I could have sold this at the close for a nice 10% gain.

So what am I doing this week? I intend to take care of business, if the market will allow me to do so. My overall plan is to position myself into my three favorite plays: USG, WNC, and SLCA. I will also keep my now reduced IMUC position. As you know, I already own USG and WNC. All three of the trades are based upon fundamental theses that extend out into the next few years. More on that will come later. For now I will ride out my RTEC and KLIC positions. If BV bounces, I will look to sell. I need to see just how bad OCLR will react tomorrow (if it falls under a buck it’s get the hell out of here time).

If you guys have any trades you think are worthy of mentioning, let me know in the comments section. Thanks ahead of time.

Portfolio Update

432 views

Aside from the weekly charts I posted in the previous blog, I really don’t have too many new ideas. Those names are all on my watchlist, so don’t be surprised if you see me purchasing them at some point in the near future. While those are purely technical, I’m looking into SLCA as a longer term, fundamentally based investment.

I sold my APP position today for a little less than an 8% gain. Not bad considering I purchased the stock three days ago. It actually looks like it’s going to continue to rip higher. I needed to sell in order to raise cash for other prospects described above.

My BV position received some love early in the trading day, as it surged over 10% for a brief 5 minutes. I thought I had really nailed it, only to watch it melt lower for the rest of the session. The technicals are still intact.

The last name I want to talk about is RTEC. It failed to recover from the earnings drop. It’s up a little after hours. After reading the Fly’s recent blog post, I’m beginning to wonder if I should cut my losses. My desire to purchase was based upon fundamentals, and I tried to time it with technicals. It managed to blow up in my face. The reason for holding on is the secondary exposure to DRAM. If I sell this position, then I know the proceeds will be promptly pumped into MU. My intuition is telling me to ride this out, and I will most likely end up doing so. Mind you, it’s a 10% position.

I will be trying to sell off my smaller positions of OCLR and BV soon. I would like to free up more cash for a new, big thesis play. I currently sit at 15% cash after selling APP  and half of my IMUC shares.

Click here for my current positions and charts on Finviz.


Prime Weekly Charts and Analysis

400 views

The Dow hit the 15,000 mark on Friday. My portfolio was all up, except for RTEC. Due to earnings, the stock traded down almost 8%. It was brought down to the critical 10.70 level. I’m still holding. I sold off half of my IMUC position for a slight gain. Lastly, I added BV. I’m close to 100% long, 0% cash.

I’ve been sifting through charts, using both The PPT and other technical screeners, to find some weekly charts with nice patterns. I would put these on a watchlist for the next couple weeks. The charts are all below.

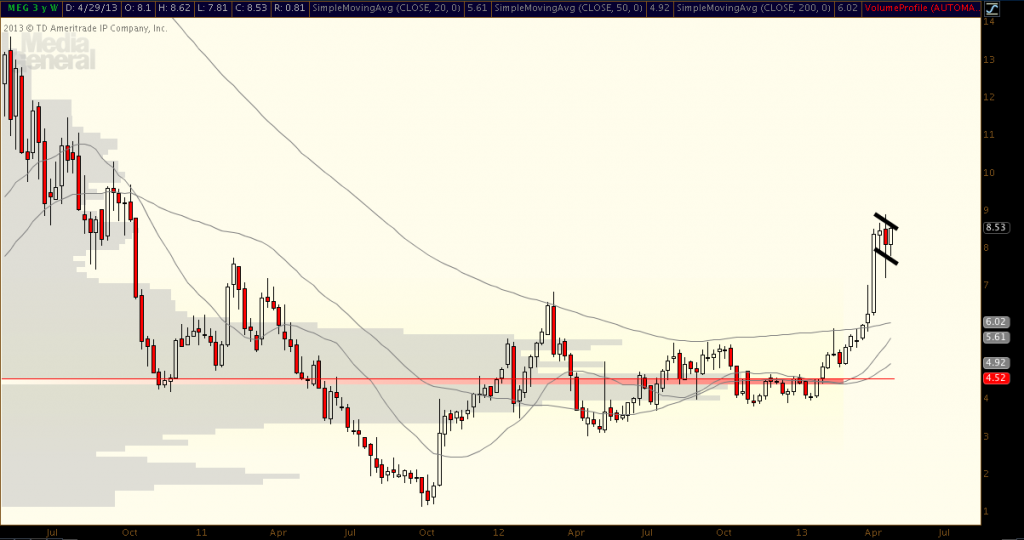
The first is MEG. It’s been bull flagging. Maybe we see another push higher to inflict more pain on the short sellers in the name.

Screen shot 2013-05-05 at 1.08.16 PM

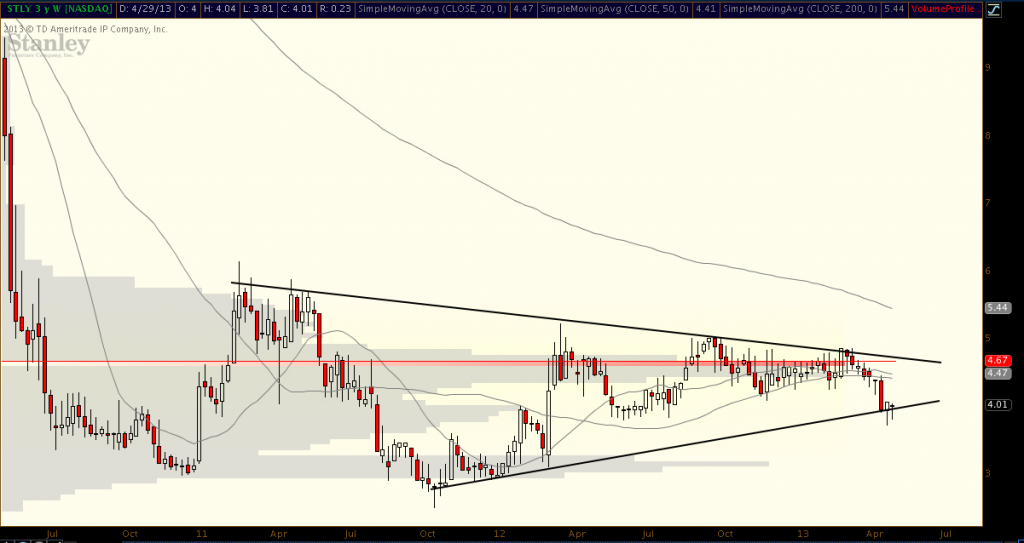
Then we have STLY. I’m watching for a short term reversal.

Screen shot 2013-05-05 at 1.02.34 PM

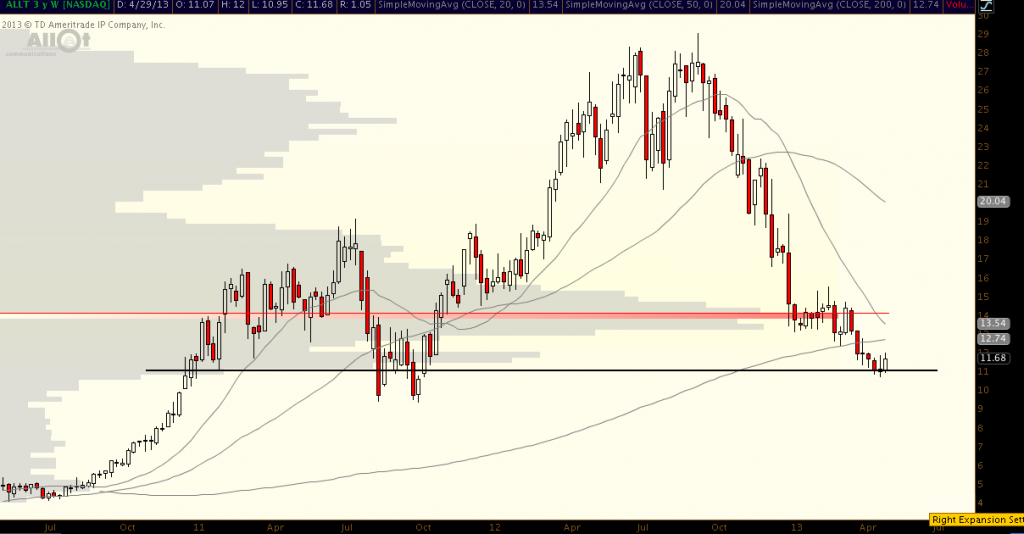
This one looks like it a falling knife. Use proper risk management for ALLT.

Screen shot 2013-05-05 at 2.54.13 AM

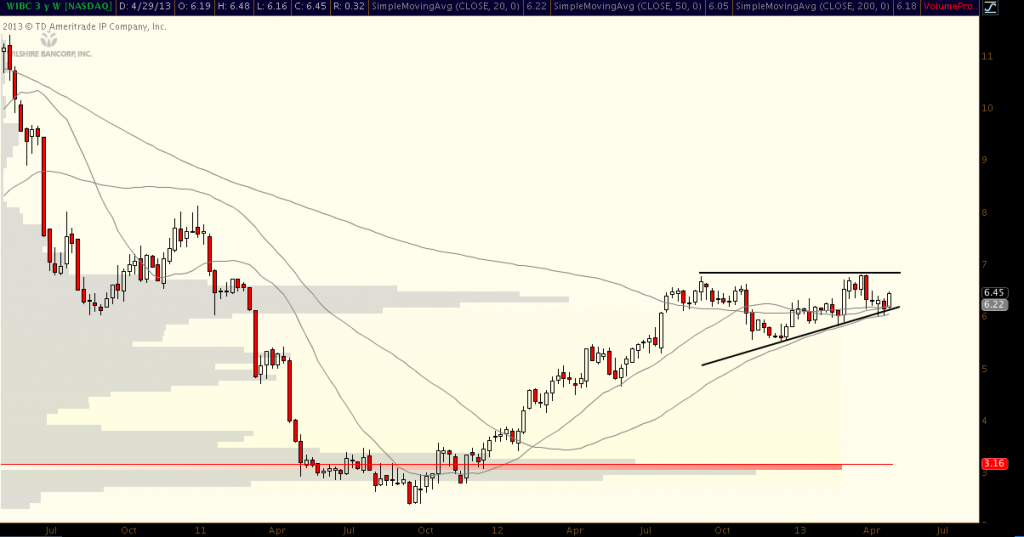
WIBC is a growth bank I’ve been following for awhile. While the daily chart looks like chaos, the weekly chart shows some constructive trading.

Screen shot 2013-05-05 at 2.49.50 AM

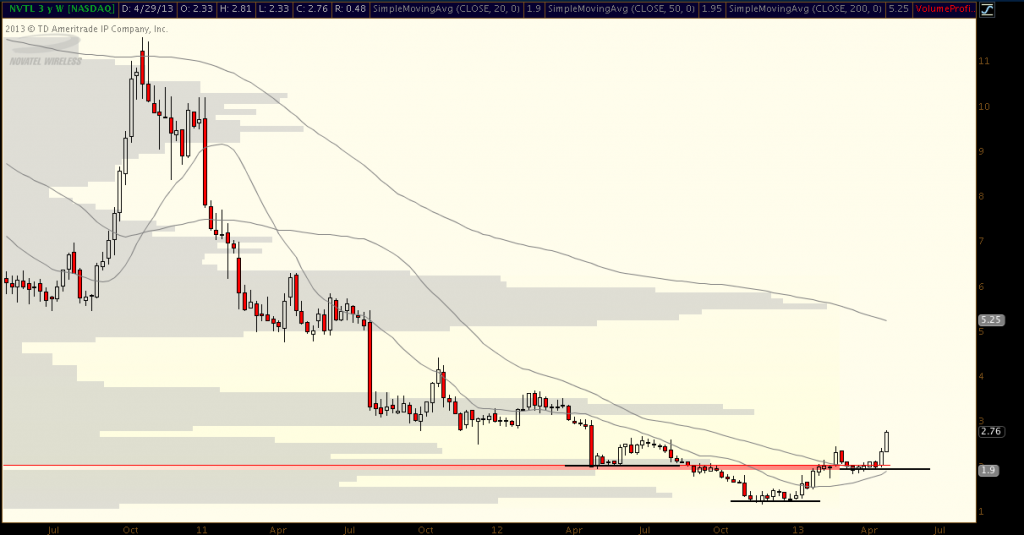
NVTL classic inverse head and shoulders bottom.

Screen shot 2013-05-05 at 2.47.48 AM

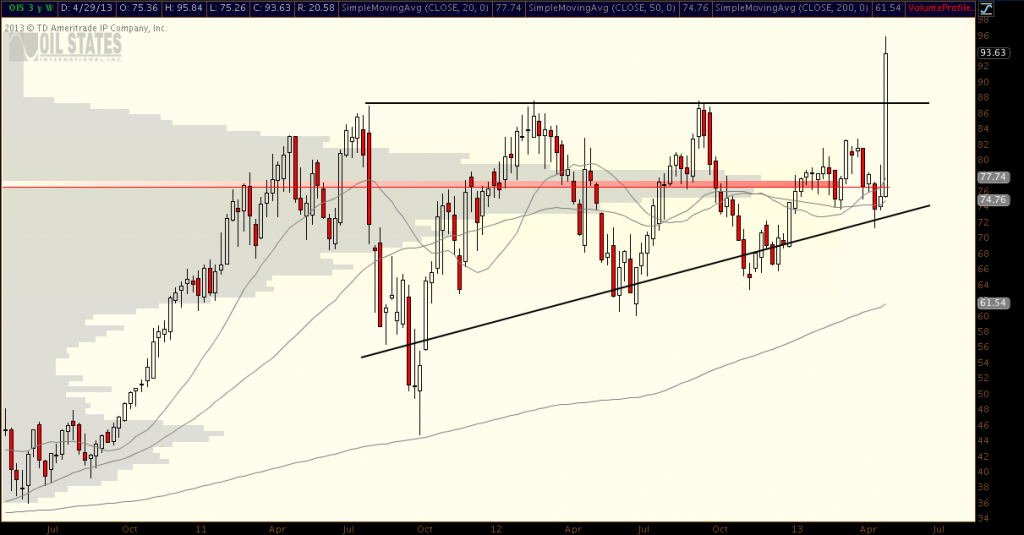
OIL. And bang, new highs.

Screen shot 2013-05-05 at 2.44.06 AM

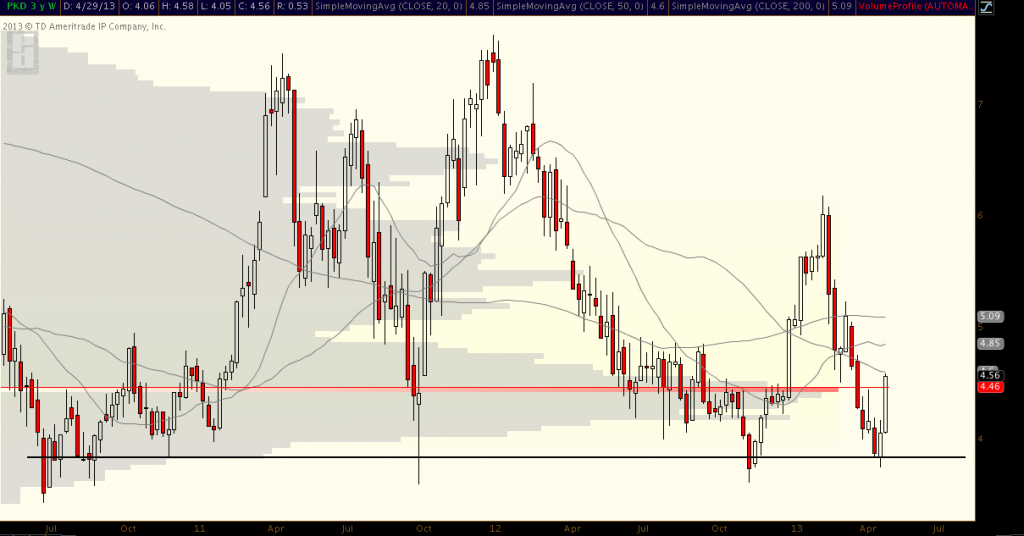
PKD is bouncing off its support. Maybe I caught it late here, but it has been explosive off these levels in the past.

Screen shot 2013-05-05 at 2.42.24 AM

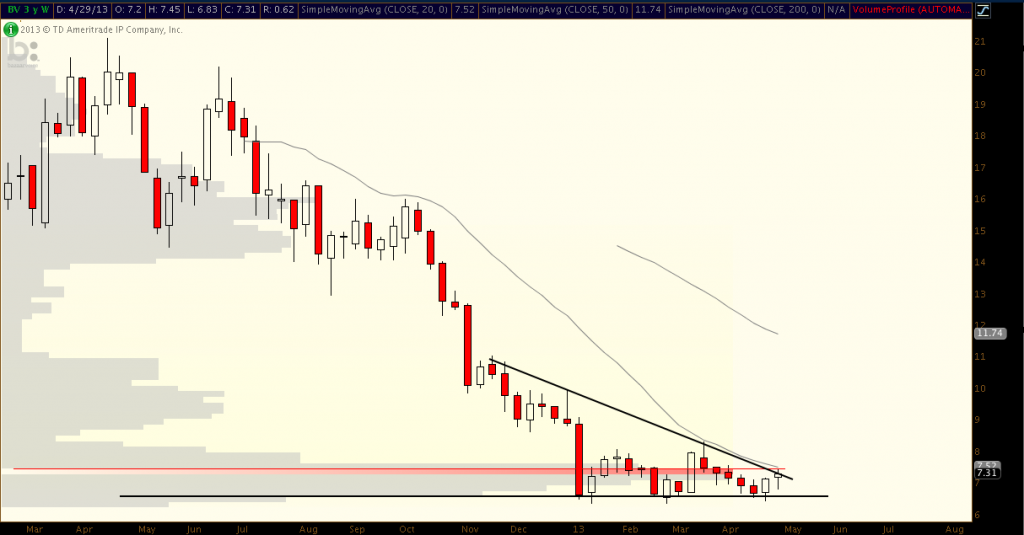
BV is a name I bought on Friday. A lot of buying has been going on down here. Also looks like a triple bottom.

Screen shot 2013-05-05 at 2.38.55 AM

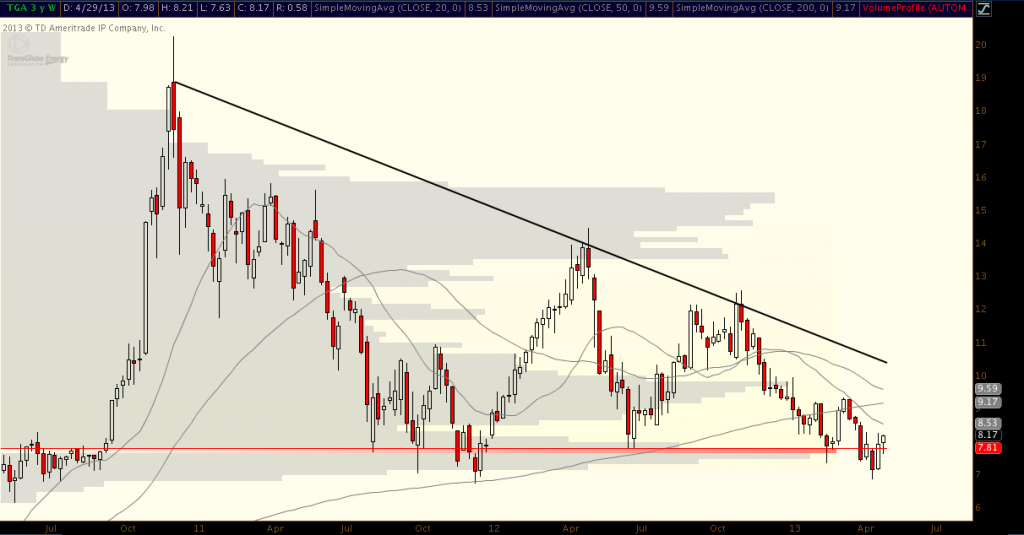
TGA is finding its support on the volume point of control. Would like to see it retest declining trendline. Inverse h&s on daily chart.

Screen shot 2013-05-05 at 2.37.43 AM

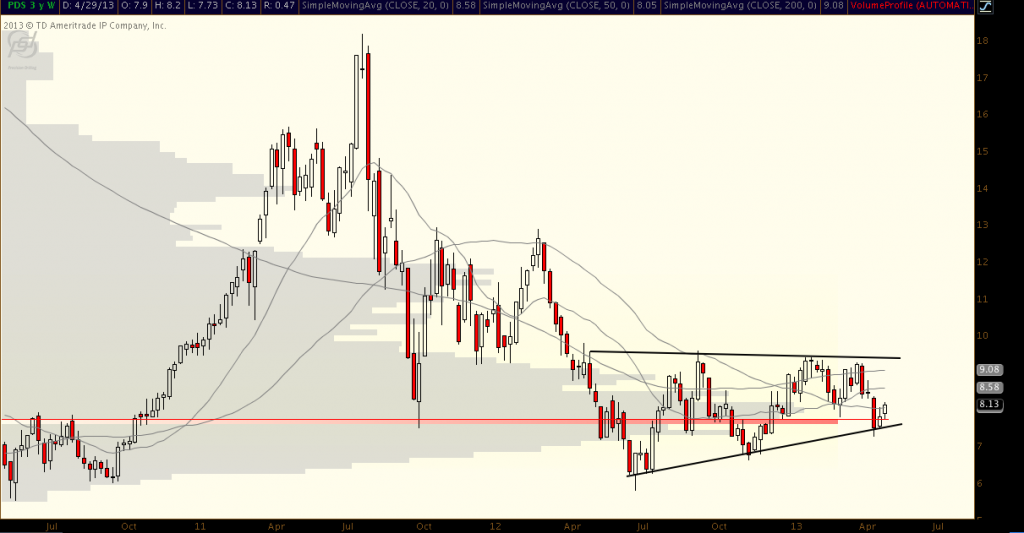
Lastly, PDS. It’s showing signs of a basing pattern/ascending triangle.

Screen shot 2013-05-05 at 2.36.03 AM


I’ve imported the names into Finviz here.

Fire in my Hood

305 views

I have been absent for a few days, but I have enjoyed the sharp rally that has brought us back to new highs. It appears that we are currently ignoring seasonality, and pressing on. My positions and charts can be found here on Finviz. I added a new position, APP. I am in this name for a quick technical trade. I remain over 90% invested to the long side. Granted, most of my stocks trade without giving a damn about the broader market.

There’s a wildfire breaking out in my hood. Everything seems under control, yet the media is pumping this like a penny stock promoter.

Untitled


There’s the inside look. Brought to you by the TPain Local News Network. Speaking of news channels, keep watching MEG for a reach to new highs. Back to the stock market. I sifted through a few setups that I believe are valuable enough for you guys to take a look at.

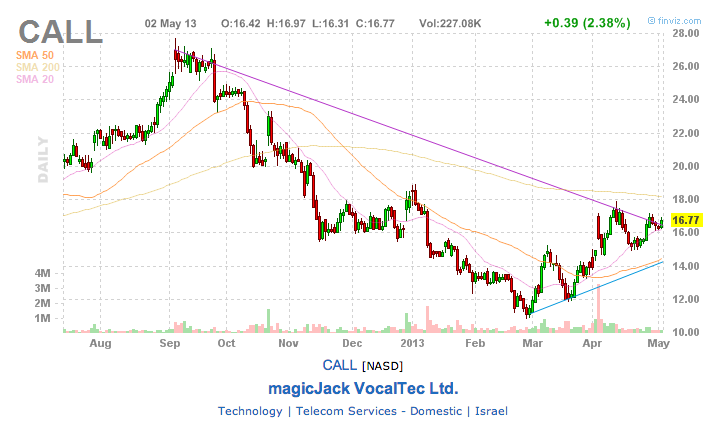
The first is CALL. This is a devil pick the Fly mentioned the other day. The technicals look ready for a short squeeze to commence.

Screen shot 2013-05-02 at 4.11.56 PM


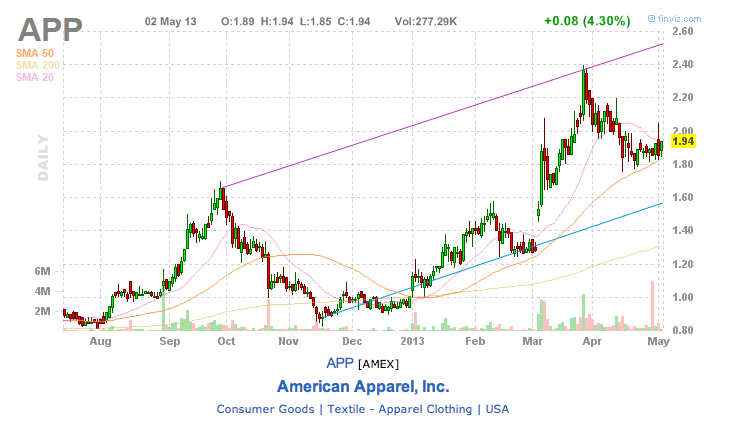
Another is APP. I bought it today. Might be a little early.

Screen shot 2013-05-02 at 4.16.26 PM


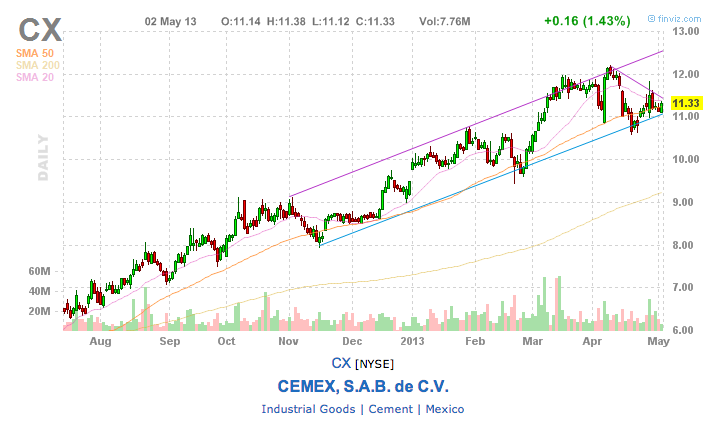
Lastly, there’s CX.

Screen shot 2013-05-02 at 4.17.36 PM


Let me know if you guys have any other setups in mind.

VDE Charts and Overview

277 views

Fellow iBankCoin user, Surf, asked me what my opinion was on the Vanguard Energy ETF (VDE), so I’m just going to walk through a basic analysis of the ETF. For those of you not acquainted with the ETF, here is a general overview:

 The investment seeks to track the performance of a benchmark index. The fund employs an indexing investment approach designed to track the performance of the MSCI US Investable Market Index (IMI)/ Energy 25/50, an index made up of stocks of large, mid-size, and small U.S. companies within the energy sector, as classified under the Global Industry Classification Standard (GICS). It attempts to replicate the target index by investing all, or substantially all, of its assets in the stocks that make up the index, holding each stock in approximately the same proportion as its weighting in the index. The fund is non-diversified.

The holdings of the fund are major oil and gas names, I have listed them below along with their percent allocation. It’s a pretty basic ETF, nothing fancy here.


Exxon Mobil Corporation Common XOM 20.66
Chevron Corporation Common Stoc CVX 12.88
Schlumberger N.V. Common Stock SLB 5.58
ConocoPhillips Common Stock COP 4.23
Occidental Petroleum Corporatio OXY 3.73
Anadarko Petroleum Corporation APC 2.24
EOG Resources, Inc. Common Stoc EOG 1.97
Halliburton Company Common Stoc HAL 1.93
Phillips 66 Common Stock PSX 1.93
Apache Corporation Common Stock APA 1.83


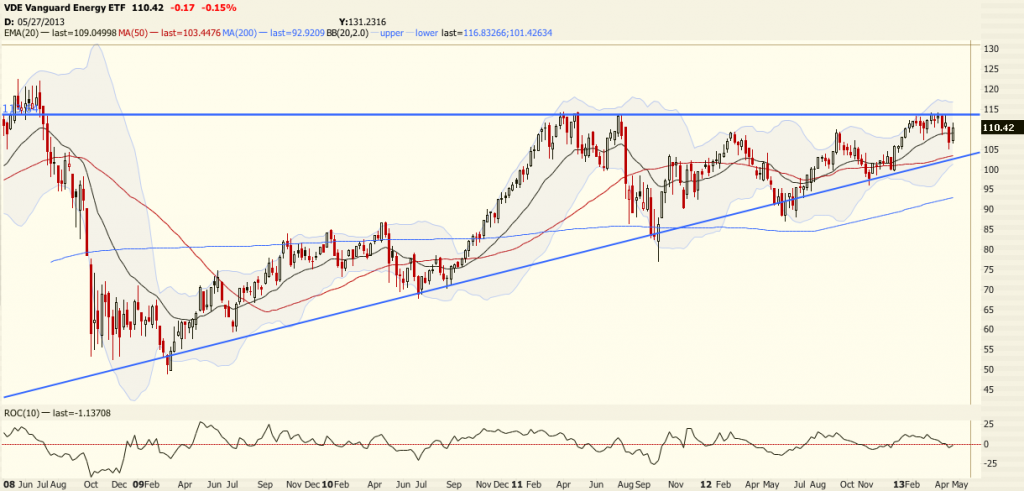
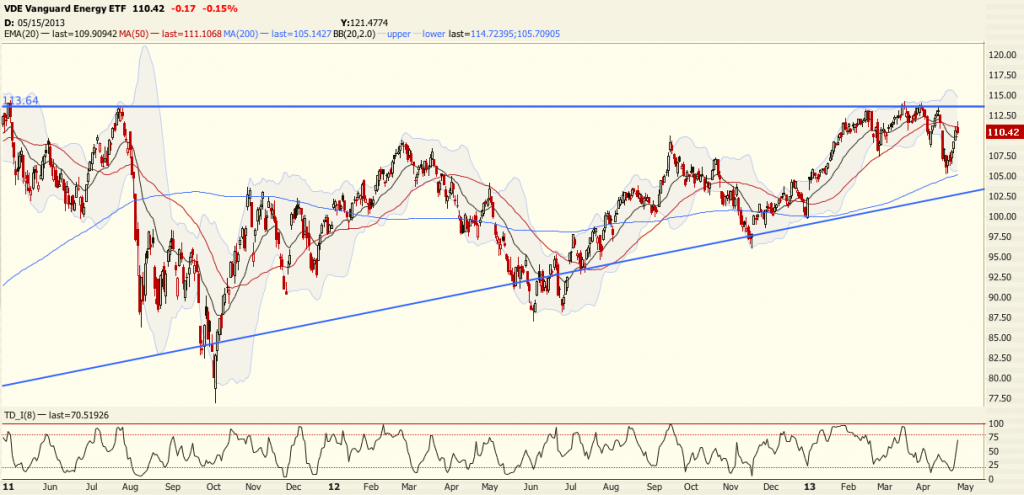
Selling my recent oil positon, I have no personal desire to re-enter the sector. However, I would actually act upon a trade if it presented itself in two specific areas on the chart: the rising trendline or a break through multi-year resistance. I have provided a 5 year weekly chart and a 2 year daily chart below.

Screen shot 2013-04-26 at 2.43.43 AM Screen shot 2013-04-26 at 2.44.53 AM

From a technical standpoint, price is currently trading between the two trigger points of the trade. The weekly shows a strong candle, but the daily reveals the possibility for a fade. I believe that the price action in today’s trading session will be a critical factor in seeing how this plays out down the road. My guess right now is that it heads slightly lower, and we roll over to correct into the 50 week moving average on the 5 year chart. A dip to those levels would put me on watch for reversal patterns,   which would provide the base for an explosive breach of the upper resistance. However, if we do not fade, then I will look to play a breakout over the horizontal resistance.

That’s my take on it. The general trend is up, so if you own some I would think that you should prepare to stomach a slight correction before hitting new highs.

Portfolio Update

157 views

I sold KLIC today for a slight gain. I will look to add back should the market conditions warrant. Other than that, my portfolio is unchanged. The past two days, both USG and SLCA have been ripping. I think that SLCA will head higher with time, my write up on it can be found here. If everything hits my targets, I will be holding two core positions by this week’s end: SLCA and WNC. I have a few speculative plays in the pipeline that should do well in this stage of the market. Check out ODP. I was stern on holding my ground, but the thought of cash is making me feel more comfortable. I was down huge last month and my stocks rallied back into the black on my books. I cannot be greedy.

My current charts and positions can be found here on FInviz.

Picking Trades

303 views

The next five sessions should be interesting for all individuals currently in the market. If the long awaited May correction is to take place, then I think that the bears will have to sink their teeth into the bulls this week. Being that I have hardly any cash on the books, it is obvious that I am unprepared for any potential sell-off that lies ahead. However, I am not going to alter my exposure or positions. I trade what I know and what I see, not what I fear or anticipate.

When my trades are not entirely based on technical analysis (like BV), they are typically generated from a fundamental idea or thesis. I then research the company extensively, looking through the SEC filings, analyst reports, and other accounting metrics to establish a sense of direction for the business. I think to myself about the current economics surrounding the industry, and then I decide if fundamentals suggest an entry into the trade. The charts then follow. Technical timing is key, and it provides a trader with a possible leg up when it comes to getting the right price. I am a firm believer in support/resistance and price history. My favorite indicator is the volume profile. Knowing where most shares have traded gives an insight into the accumulation of shares at certain price levels. It allows a trader to see where the market values the company, which is always different than financially based valuations. If the fundamentals and technicals line up, I then place my order. This is not some bullet proof method of course, as technical analysis can lead to results that are opposite of what is anticipated. Meanwhile, fundamental theses can blow up before your eyes. It is all about the edge it provides. We know we will all fail occasionally, but the better your filter, the higher your win percentage will be over time. That is my theory, anyway.

I am looking for my technical BV to trade up to 8.00 this week, and I will look to sell there if it cannot break through with volume or strength. To be honest, I am quite satisfied with my all of my positions from a technical standpoint. My current positions and charts can be found here on Finviz. Each position looks like it is at an actionable point, especially USG and VHC. Time will tell.

I have a couple of other fundamental trades in mind, and I am currently delving into the companies in my spare time. I plan to have a couple of write  ups by mid-week. I have more cash flowing into my brokerage account, as these said companies are going to be my summer plays. I think you will find them more interesting than silica sand.

I will leave you with two chart ideas: TGA and HMA.


A Case for US Silica

559 views

I started a 10% position in US Silica (SLCA) today. I managed to pick some shares up on the lows to benefit from a nice gain by the close of the market. However, I am hoping that it does not run away from me in the short term because I am willing to stuff my cash from other names into this company. The PPT is suggesting a short term rip higher may be in the works, as it was oversold on the 3 month time frame after yesterday’s session.

I found the company after reviewing the Fly’s GARP watchlist. They sport a quarterly revenue growth of 20% and a low PEG multiple of .30. The revenue growth should be expected due to the known boom in the demand for proppants used in horizontal drilling, and the low PEG multiple represents the hesitations surrounding the industry as a whole. Is growth tapering off? Is supply meeting demand? Isn’t fracking terrible for the environment? Going forward, I think that we should go with the trend. Fracking is going to continue whether you have environmental reservations about it or not. Oil and gas will have their way in the long run, and if you want to bet against that, then you are going to lose money. Volts, Leafs, and Teslas are not going to flood America overnight. Oil needs to be accessed, and the use of silica to obtain it will grow through the course of time. Coupling that with a potential bottoming in natural gas, the industry becomes much more appealing.

Within this industry, transportation costs lead to the fragmented isolation of markets. Silica sand is far too bulky and heavy to transport without paying a high fee. Subsequently, this results in barriers to entry. Pricing then boils down to who is the closest to the specific job site, and how much they can supply. Due to this, a lot of smaller guys will pop up and attempt to take their stake in a small market. US Silica recently partnered with BNSF to transport their products via rail. Through this, the company has greater access to markets and can actively compete in a manner that the smaller guys cannot afford to. While there are claims that frac sand supply is meeting demand (if they are true), I do not think that this will have an immediate effect on the company itself. Growth can be found through increasing its customer base through the utilization of rail. Sure, they cannot have every market, but why not grab the largest share that you can?

US Silica operates in two different business segments: the oil and gas proppant space and the industrial/specialized product space. Compared to the prior year, the company’s oil and gas proppant sales grew by an impressive 37%, whereas the industrial/specialized sales were hardly changed. Viewed together, that is an increase of 19.7%. The benefit of the dichotomy is the inherent diversification. The uses of silica sand are still being realized, and thus I would not discount the ability of the the industrial/specialized segment to grow in the long term.

The reason I started a position was because of the recent pull back from the highs of the stock price. I think that this would be a good time to add, and it is worth noting that most shares have traded right at this level. This suggests that fair value, from a volume perspective, is right upon us. Depending upon the price action, I am willing to increase this position size to 20% of my assets. I think the price can rise to about $26 a share if the market sentiment becomes bullish again.

A competitor to note is HCLP, which pays a 10% dividend. The company suffered a drawdown in its share price after losing its largest customer. It has since recovered. I think that US Silica is safer in that regard, as they have managed to maintain longer term contracts with their biggest buyers. Prices in these contracts are set at a fixed rate, and are adjusted should transportation costs warrant. I know this is a rather brief write up as to why I am so bullish. I have more reasons, just not enough time to pen them. I will try to follow up with more work on this name as time goes on.
A little Background about Myself

627 views

I started writing blogs within the iBankCoin Blogger Network in February. Since then, I have written about 30 posts. That pales in comparison to others on this site. I have enjoyed writing and posting ideas, and I know a couple people out there are listening (shout out to Vertigo). Most of these posts are written to generate ideas, but more importantly they serve as a journal for myself. Blogging my thoughts and making them presentable to you guys helps me out a lot, and I don’t think it hurts you at all. I think I should share some background as to who I am, without revealing too much at the same time. Anonymity seems to be the theme on this site, so I will stick with my funky rapper name of Tpain.

I am an undergraduate Economics student at a top university. Since trading isn’t taught in textbooks, I decided to venture into the investment world on my own. I have experience day trading from working with a proprietary firm, but I have since moved on because scalping the market became frustrating. Finding setups that would break out or down based entirely on chart patterns became too time consuming, and using the firms capital started to stress me out. I didn’t like someone telling me to sell my shares or cover my short when it was working. I had some cash so I thought to myself, why not do this on my own? I developed a trading style that is a mix of swing trading and position trading (very similar to most on this site), and so far it has been working. I take enjoyment in developing a thesis for a trade. Sifting through annual and quarter reports to find anomalies is fun to me. I hope that doesn’t sound sick or something. Overall, I have only 3 years of experience in active, real money trading. I have been interested in stocks since I was 15 and always paper traded while sitting in my high school classes. So far I have made some decent returns, and family members and friends are now asking me to manage their accounts. I don’t know if that’s a good thing or a bad thing…I feel that I need to prove myself more in order to trust myself with other peoples money. With that being said, I have accepted a few due to pressure.

Okay, so that’s my background as it pertains to trading. Maybe as time goes on you guys can read about my “interesting” life.

Undervalued Wanting Higher

224 views

I have a screen in The PPT that scans for stocks based upon their 6 month return, book value, and earnings/revenue growth. About a month ago I posted some suggestions from the screen. This is to simply remind you of them. The charts and tickers are here on FINVIZ.

As a brief update, I sold OCLR  at 1.10 for a nice 20% loss. Never hold through earnings…


My Plans for the Rest of this Week

320 views

The only variable positions in my portfolio are those that I initiate through technical analysis. Certain geometrical patterns appeal to my gambling mind, and when they pop up I tend to throw some money at them. For instance, look at BV and OCLR. I have no reason to own these stocks for any fundamental reasons, for they are absolute garbage by my standards. Is there a pipeline in the works between either of the companies for a strong thesis trade? No. Look at the charts below.

Screen shot 2013-05-07 at 10.54.09 PM Screen shot 2013-05-07 at 10.53.48 PM


The key here is position sizes. Both of these patterns rely on the break of descending trendline, which often can fail if there is an overall bearish sentiment for the stock. The risk/reward is high. I never allocate more than 10% for a position like these. In this case, BV is sitting right at 10%, and OCLR is just below 5%. I am fairly confident with BV due to the high short float and the rather recent IPO. However, I have made a very bad mistake with OCLR. I held through earnings. The earnings report was awful, and as a result, their stock is set to drop by 20% tomorrow morning. I could have sold this at the close for a nice 10% gain.

So what am I doing this week? I intend to take care of business, if the market will allow me to do so. My overall plan is to position myself into my three favorite plays: USG, WNC, and SLCA. I will also keep my now reduced IMUC position. As you know, I already own USG and WNC. All three of the trades are based upon fundamental theses that extend out into the next few years. More on that will come later. For now I will ride out my RTEC and KLIC positions. If BV bounces, I will look to sell. I need to see just how bad OCLR will react tomorrow (if it falls under a buck it’s get the hell out of here time).

If you guys have any trades you think are worthy of mentioning, let me know in the comments section. Thanks ahead of time.

Portfolio Update

432 views

Aside from the weekly charts I posted in the previous blog, I really don’t have too many new ideas. Those names are all on my watchlist, so don’t be surprised if you see me purchasing them at some point in the near future. While those are purely technical, I’m looking into SLCA as a longer term, fundamentally based investment.

I sold my APP position today for a little less than an 8% gain. Not bad considering I purchased the stock three days ago. It actually looks like it’s going to continue to rip higher. I needed to sell in order to raise cash for other prospects described above.

My BV position received some love early in the trading day, as it surged over 10% for a brief 5 minutes. I thought I had really nailed it, only to watch it melt lower for the rest of the session. The technicals are still intact.

The last name I want to talk about is RTEC. It failed to recover from the earnings drop. It’s up a little after hours. After reading the Fly’s recent blog post, I’m beginning to wonder if I should cut my losses. My desire to purchase was based upon fundamentals, and I tried to time it with technicals. It managed to blow up in my face. The reason for holding on is the secondary exposure to DRAM. If I sell this position, then I know the proceeds will be promptly pumped into MU. My intuition is telling me to ride this out, and I will most likely end up doing so. Mind you, it’s a 10% position.

I will be trying to sell off my smaller positions of OCLR and BV soon. I would like to free up more cash for a new, big thesis play. I currently sit at 15% cash after selling APP  and half of my IMUC shares.

Click here for my current positions and charts on Finviz.


Prime Weekly Charts and Analysis

400 views

The Dow hit the 15,000 mark on Friday. My portfolio was all up, except for RTEC. Due to earnings, the stock traded down almost 8%. It was brought down to the critical 10.70 level. I’m still holding. I sold off half of my IMUC position for a slight gain. Lastly, I added BV. I’m close to 100% long, 0% cash.

I’ve been sifting through charts, using both The PPT and other technical screeners, to find some weekly charts with nice patterns. I would put these on a watchlist for the next couple weeks. The charts are all below.

The first is MEG. It’s been bull flagging. Maybe we see another push higher to inflict more pain on the short sellers in the name.

Screen shot 2013-05-05 at 1.08.16 PM

Then we have STLY. I’m watching for a short term reversal.

Screen shot 2013-05-05 at 1.02.34 PM

This one looks like it a falling knife. Use proper risk management for ALLT.

Screen shot 2013-05-05 at 2.54.13 AM

WIBC is a growth bank I’ve been following for awhile. While the daily chart looks like chaos, the weekly chart shows some constructive trading.

Screen shot 2013-05-05 at 2.49.50 AM

NVTL classic inverse head and shoulders bottom.

Screen shot 2013-05-05 at 2.47.48 AM

OIL. And bang, new highs.

Screen shot 2013-05-05 at 2.44.06 AM

PKD is bouncing off its support. Maybe I caught it late here, but it has been explosive off these levels in the past.

Screen shot 2013-05-05 at 2.42.24 AM

BV is a name I bought on Friday. A lot of buying has been going on down here. Also looks like a triple bottom.

Screen shot 2013-05-05 at 2.38.55 AM

TGA is finding its support on the volume point of control. Would like to see it retest declining trendline. Inverse h&s on daily chart.

Screen shot 2013-05-05 at 2.37.43 AM

Lastly, PDS. It’s showing signs of a basing pattern/ascending triangle.

Screen shot 2013-05-05 at 2.36.03 AM


I’ve imported the names into Finviz here.

Fire in my Hood

305 views

I have been absent for a few days, but I have enjoyed the sharp rally that has brought us back to new highs. It appears that we are currently ignoring seasonality, and pressing on. My positions and charts can be found here on Finviz. I added a new position, APP. I am in this name for a quick technical trade. I remain over 90% invested to the long side. Granted, most of my stocks trade without giving a damn about the broader market.

There’s a wildfire breaking out in my hood. Everything seems under control, yet the media is pumping this like a penny stock promoter.

Untitled


There’s the inside look. Brought to you by the TPain Local News Network. Speaking of news channels, keep watching MEG for a reach to new highs. Back to the stock market. I sifted through a few setups that I believe are valuable enough for you guys to take a look at.

The first is CALL. This is a devil pick the Fly mentioned the other day. The technicals look ready for a short squeeze to commence.

Screen shot 2013-05-02 at 4.11.56 PM


Another is APP. I bought it today. Might be a little early.

Screen shot 2013-05-02 at 4.16.26 PM


Lastly, there’s CX.

Screen shot 2013-05-02 at 4.17.36 PM


Let me know if you guys have any other setups in mind.

VDE Charts and Overview

277 views

Fellow iBankCoin user, Surf, asked me what my opinion was on the Vanguard Energy ETF (VDE), so I’m just going to walk through a basic analysis of the ETF. For those of you not acquainted with the ETF, here is a general overview:

 The investment seeks to track the performance of a benchmark index. The fund employs an indexing investment approach designed to track the performance of the MSCI US Investable Market Index (IMI)/ Energy 25/50, an index made up of stocks of large, mid-size, and small U.S. companies within the energy sector, as classified under the Global Industry Classification Standard (GICS). It attempts to replicate the target index by investing all, or substantially all, of its assets in the stocks that make up the index, holding each stock in approximately the same proportion as its weighting in the index. The fund is non-diversified.

The holdings of the fund are major oil and gas names, I have listed them below along with their percent allocation. It’s a pretty basic ETF, nothing fancy here.


Exxon Mobil Corporation Common XOM 20.66
Chevron Corporation Common Stoc CVX 12.88
Schlumberger N.V. Common Stock SLB 5.58
ConocoPhillips Common Stock COP 4.23
Occidental Petroleum Corporatio OXY 3.73
Anadarko Petroleum Corporation APC 2.24
EOG Resources, Inc. Common Stoc EOG 1.97
Halliburton Company Common Stoc HAL 1.93
Phillips 66 Common Stock PSX 1.93
Apache Corporation Common Stock APA 1.83


Selling my recent oil positon, I have no personal desire to re-enter the sector. However, I would actually act upon a trade if it presented itself in two specific areas on the chart: the rising trendline or a break through multi-year resistance. I have provided a 5 year weekly chart and a 2 year daily chart below.

Screen shot 2013-04-26 at 2.43.43 AM Screen shot 2013-04-26 at 2.44.53 AM

From a technical standpoint, price is currently trading between the two trigger points of the trade. The weekly shows a strong candle, but the daily reveals the possibility for a fade. I believe that the price action in today’s trading session will be a critical factor in seeing how this plays out down the road. My guess right now is that it heads slightly lower, and we roll over to correct into the 50 week moving average on the 5 year chart. A dip to those levels would put me on watch for reversal patterns,   which would provide the base for an explosive breach of the upper resistance. However, if we do not fade, then I will look to play a breakout over the horizontal resistance.

That’s my take on it. The general trend is up, so if you own some I would think that you should prepare to stomach a slight correction before hitting new highs.

Previous Posts by tpain
Glory Restored
0 comments