In my previous post on Point and Figure, I covered the two main trend lines, the Bullish Support Line and the Bearish Resistance Line, and how they come into play. I briefly touched on the subject of establishing a price objective for a stock.
In today’s post we’ll get into the usefulness of determining a price objective, why you must have a price objective, and how you go about calculating it. In PnF, there are two different ways to do this: the “Vertical Count” and the “Horizontal Count”.
Price objectives are important. If you’re trading without a sense of where a stock is going, or where it might be going if the position moves against you, you’re just rolling the dice. You might as well jettison your money into a black hole.
Many investors and traders approach the market like it’s a game. It’s entertainment to them. After all, it’s fun trading stocks, right?
If you are serious about making money in the market, you have to treat your trading just like any business you might own and operate. It’s not a game. It’s a business venture, and it’s full of risk. Most of you already know this, but I’m addressing the newbie or “dabbler” in the market.
If you’re not serious about establishing and using a disciplined system for trading (or investing), you will lose your stake. There are many people in this business that are a lot smarter and experienced than you or me. Just ask The Fly (who I’m sure will wholeheartedly agree). How you go about establishing an effective trading system is a whole different topic. There are many books describing many systems of trading. My advice is to develop or use one that fits your personality, temperment, and style. And keep it simple.
PnF analysis gives us a way to calculate the price objective of a stock, whether we are going long or short. This is critical for when we do a risk-reward analysis (you do a risk-reward analysis before you put on a trade, don’t you?)
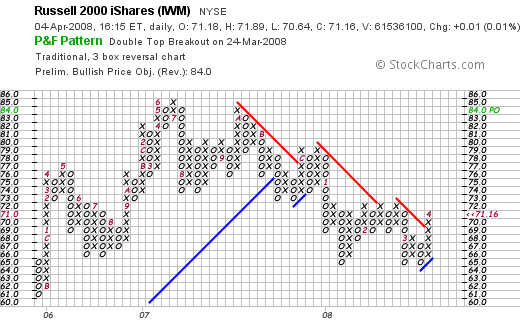
Let’s look at the Russell 2000 iShare [[IWM]]:

From the chart, you can see that the Price Objective shown on the right hand side is 84. Later on, I’ll get into how it’s calculated. Since we are all internets and live in the internet age, we have computers that conveniently do this for us, but it’s important to know how the number is arrived at, especially if you are “low tech” (over 47 1/2), and want to chart your stocks by hand like the “old guys”, circa 1929.
IWM has broken through the Bearish Resistance Line and is above the Bullish Support Line. It has also broken a double top. That is a clear buy signal. So let’s do a quick risk-reward analysis to see if this is a trade still worth taking.
It closed at 71.16 on Friday. We’ll use 71 for the sake of simple math. So the potential is 13 points. (The price objective of 84 minus 71). What’s the downside? From the chart, the Bullish Support Line is at 65. So if it breaks that, being the disciplined trader that you are, you would close out the position. Maybe you place your stop at 64.
Now you’ve established a downside risk of 7 points (71 minus 64). Is this a trade you might take? Maybe. I typically want to see 2 points upside for every point of downside, at a minimum. The upside on IWM is 13 points. The downside is 7 points. Not quite 2 to 1, but close. Maybe you place your stop at 65 instead, or even higher, thus increasing the reward to risk. Having a price objective comes in handy when making these kinds of decisions.
That’s great, you say, but how are price objectives arrived at? There are two ways. We”ll go over the vertical count and the horizontal count.
The Vertical Count
One of the nice things about PnF is that the math is so simple a fifth grader could to it. No head-exploding calculus or Monte Carlo analysis is needed.
To calculate the vertical count, we’ll look again at IWM to see how the Price Objective of 84 was arrived at.
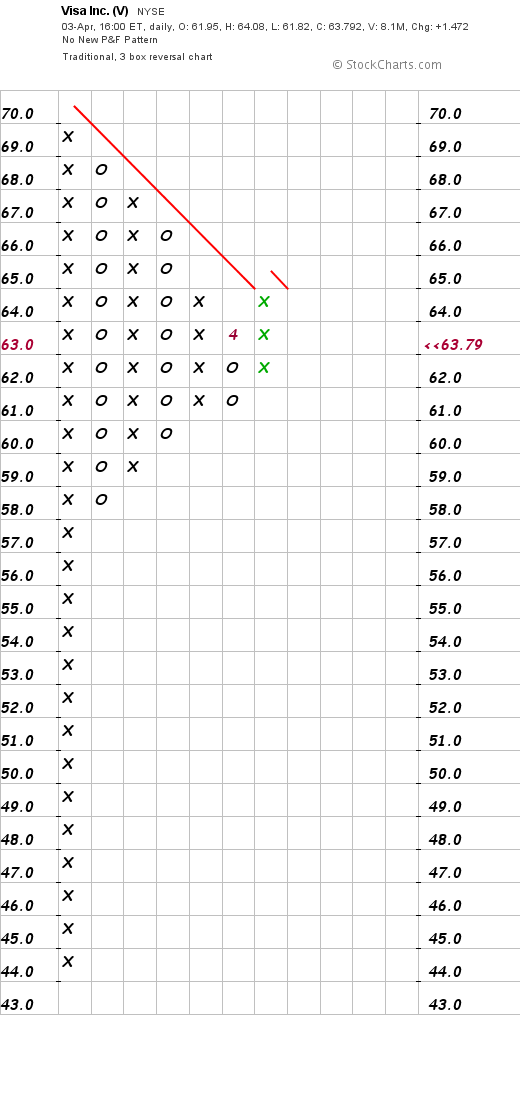
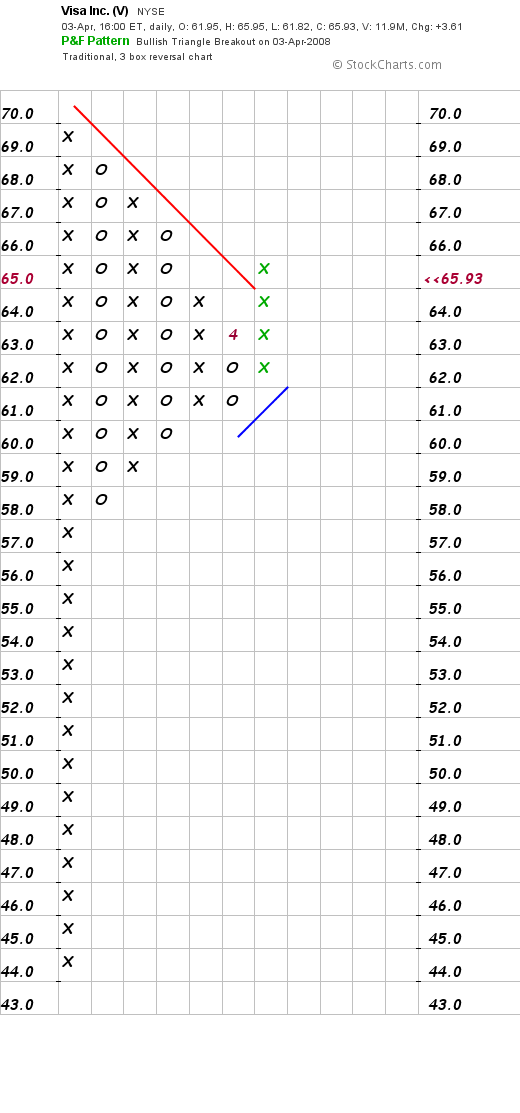
IWM bottomed out at 65 and began to move up. Then it gave a buy signal . The buy signal came when the column of X’s exceeded the previous column of X’s. This is called a double top breakout. In this case, the buy signal came at 69 (intraday).
To determine the price objective, you count the number of X’s in the column and multiply that number by 3 (since we are using the three box reversal method). Then multiply that figure by the value per box. Since IWM is trading between 20 and 100, the value of each box is 1.
There are six boxes in the column of X’s, so 6 x 3 x 1 = 18.
Take that number and add it to the bottom of the column of X’s at the level where the column began. That number is 66. Now add 18 to 66. What do you get? Using the vertical count will give you a rough idea of of the stock’s price objective on that move.
Keep in mind that this is only a guideline. It is not set in stone. Just because a stock reaches its price objective doesn’t mean that you automatically sell it. A lot will depend on the current price trend, relative strength, trading bands, resistance, momentum, etc.
Vertical Count on a Short Sale
The calculation for the vertical count on a short sale is similar to that of a long position, except that instead of multiplying the move by 3, you multiply by 2 . Take a look at everybody’s favorite short, [[FED]].
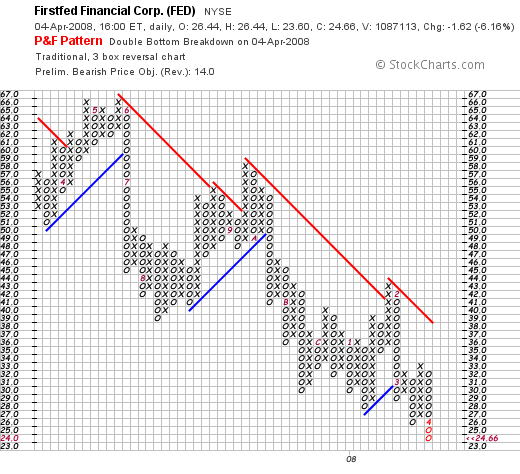
FED has given a strong sell signal, breaking a double bottom, and is well below any Bullish Support Line. How low can it go? First count the number of boxes in O’s. There are nine. Multiply that times 2, and you get 18. Now subtract 18 from 32 (the price level equivalent to the first box at the top of the column of O’s). FED’s price objective on a short sale is 14. At this point, I would do a risk-reward analysis to determine if it’s a trade I want to put on, and where I would want to place a buy stop to cover if the short position moved against me.
The Horizontal Count
Another way to determine price objective is by using the horizontal count. To do a horizontal count, you would first count the number of boxes across the base a stock has built. Then multiply that number by 3 ,and then multiply that number by the box value. We’ll use [[POT]] for our example.
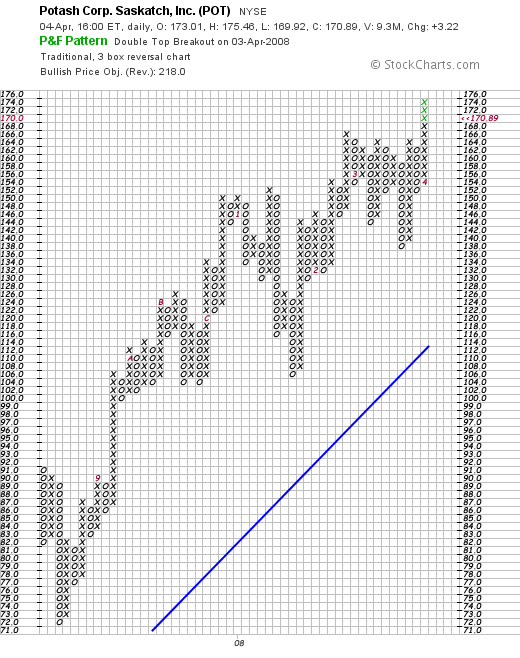
POT has broken a double top (again), much to the chagrin of the “ag shitters”.
The useful thing about a horizontal count is that you can easily tell which stocks are breaking out of a large base. In the case of POT, it gave a buy signal at 166. That is pretty easy to see on the PnF chart. This is another advantage of PnF.
Look at the base of the formation it broke out of. That formation is 11 boxes wide at the 156 through 158 levels. That is a very large basing pattern. Normally, a base might be 6 or 7 boxes before a breakout; often times, only 3 or 4.
Using the formula for the horizontal count: 11 x 3 = 33 x 2 points/box = 66. Now look at the bottom box of the column of X’s. It is at 154.
Price objective : 154 + 66 = 220
If you like the idea of buying (or shorting) a stock that is breaking out of a large base, look at the horizontal count. Going back to the example of ballistics, think of the horizontal count as the powder charge. The bigger the charge, the farther and more power the bullet has.
If you like the idea of buying (or shorting) a stock that has momentum going for it, look at the vertical count. You can think of the vertical count as the distance the bullet will travel before gravity pulls it back down to the ground.
I like to use both counts to get a better perspective in determining price objective.
Finally, remember that calculating the price objective is simply a guideline. It is useful in helping you analyze risk-reward. Use the “count” as a guide, but don’t get hung up on it.
It is more important to consider the market sentiment, sector, relative strength and chart patterns when initiating long or short trades.
Comments »