and

charting (Part III)…..
Let’s pick up where we left off last time. But before we get into it, I want to express my gratitude to the PG for their vote of confidence, thus helping me land in this place of honor and ridicule.
If you read my previous post (Part II), you must conclude that PnF charting is straightforward and simple. In fact, so simple that it could be taught to a fifth grader. (For those of you who are having trouble grasping the principles of PnF so far, congratulations. You are firmly entrenched in the sub-90 IQ bracket).
The Bearish Resistance Line
This trend line is the “Costanza” of the Bullish Support Line—the exact opposite. When a stock forms an area of distribution above the Bullish Support Line, and gives it’s first reversal sell signal, the Bearish Resistance Line can be drawn by going to the top X and starting the trend line in the box directly above that column of X’s. Let’s take a look again at the overly leveraged and brain-damaged JPM:
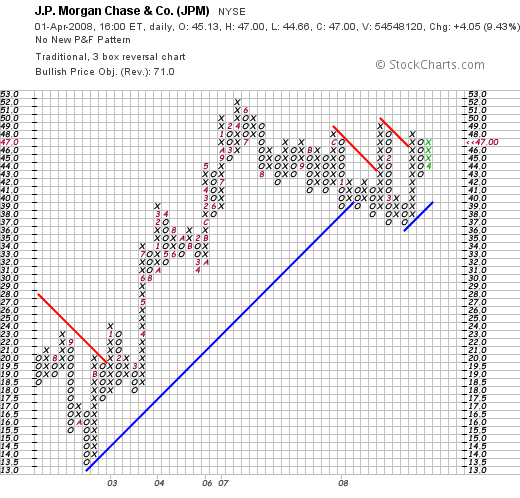
Notice how the stock was in a column of X’s just prior to Februrary (“2”) when it subsequently reversed from 49 and spiraled down to 37. You can see how the most recent Bearish Resistance Line in red was started in the box directly above the column of X’s. See how the boxes are connected diagonally down in a 135-degree angle? Actually, all one really needs to do is connect the boxes sloping down diagonally to the right and the angle will be 135 degrees. Put the protractor away.
Now we have established two trend lines. The Bullish Support Line(s) represented in blue, and the Bearish Resistance Line(s) represented in red. This Bearish Resistance Line can act in similar fashion to the Bullish Support Line—like a spiked medieval brick wall.
Typically, you don’t want to buy a stock when it is below the Bearish Resistance Line and in a column of O’s. You may consider shorting it. In fact, a good candidate for a short sale is a stock in a column of O’s that is below both the Bearish Resistance Line and the Bullish Support Line.
Bear (BSC) is a classic example:
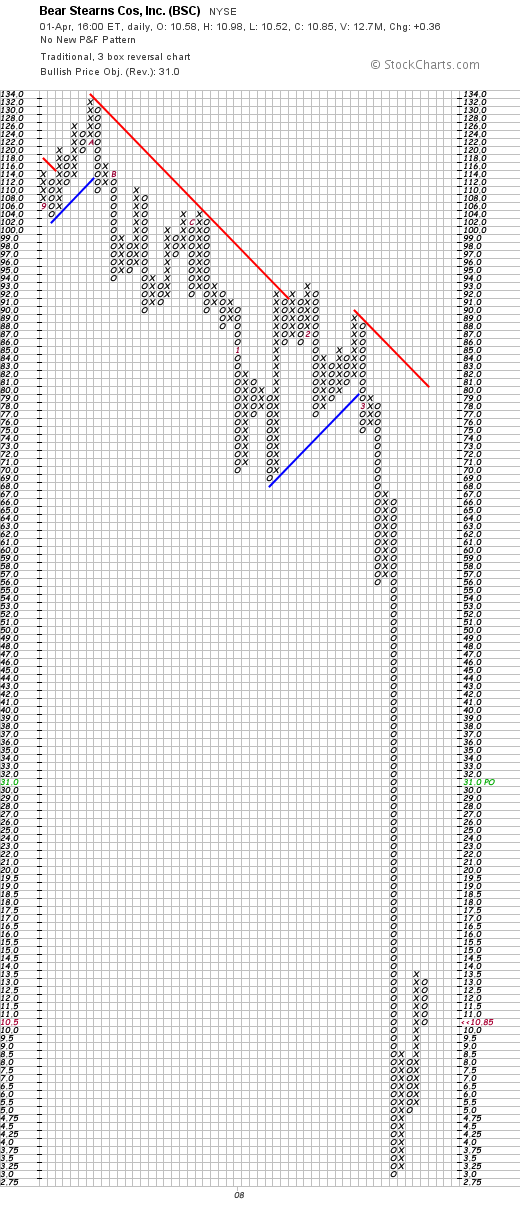
Bear was in a column of O’s and below both trend lines when it broke a double bottom at 74. The stock then broke down completely and blew through any trace of a Bullish Support Line like shit through a goose.
Another thing…be wary of buy signals that come from just below the Bearish Resistance Line. They can be false signals designed to “black hole” your trading account. Looking again at BSC, it was in a column of O’s in early March (3) and dropped to 75 before giving a buy signal by reversing up to 79. But look at where the stock’s price was relative to the two trend lines. Had you taken the buy signal and then went on a camel-trekking vacation to Libya, you would have recently returned to see your BSC backstopped at $10. Not good.
Before you go long, the general rule is that a stock must be on a buy signal that has penetrated the Bearish Resistance Line. Having said that, the chart of JPM looks quite interesting.
The chart is showing us that if JPM can get to 48, it could run up to 52, with little or no resistance from Jamie Dimon (which doesn’t make any sense either). It is already above both the Bullish Support and Bearish Resistance trend lines, so it may behoove you to study it closer.
The Bullish Resistance Line and the Bearish Support Line
I won’t get into the details on these other two trend lines. To be honest, I pretty much ignore them because they tend to complicate the analysis. Keep it simple. Don’t be drawing lines all over the place that it starts to look like downtown NYC (though I haven’t seen it lately). However, I would be willing to cover these two topics in a later post, if people are interested in drawing lots of lines on a chart.
Price Objectives
Another interesting feature of the PnF charts is the determination of price objectives. How high or low can a stock go? To figure this out, PnF technical analysis uses the science of ballistics. Putting guns together with technical analysis? Works for me.
The distance a bullet will travel can be calculated by knowing the following:
1. The size of the gunpowder charge that will propel the bullet
2. The length of the rifle barrel
3. The resistance the bullet will experience traveling through the barrel
4. The air temperature
5. The attitude (angle of elevation) of the rifle.
The same principles of ballistics are applied to PnF calculations for price objectives using two methods: the “horizontal count” and the “vertical count”.
By determining a price objective, you now have a number to use in your risk-reward calculation. Typically, I want to have two points on the upside for every point on the downside, minimum. Three is better. Four is even better than three, etc., etc. By looking at a stock through the lens of PnF, you can also corroborate your analysis with other methods like trading bands, relative strength, Fibonacci, etc.
Keeping it all in perspective, even though a stock may reach a price objective, that doesn’t mean you automatically sell it (long position) or buy it back (to cover a short position.). Consider what the relative strength and trend are doing. On a long trade, if the relative strength is still strong and the trend is up, you might want to take some profits off the table and leave a partial position.
The charts on www.stockcharts.com will calculate the price objectives (P.O.) for you. You can see them on the right side of the chart.
Next time, I will cover how you calculate the price objective from the vertical count and horizontal count. Even though you can read it from a computerized chart, it’s always good to know how the numbers are derived—especially if you have to trade without electricity and a computer, like during Armageddon or some cataclysmic event like that.
Finally, we’ll get into the fun part: reading and analyzing chart patterns. Until next time….
Comments »