iBankCoin
Home / About The PPT (page 28)

About The PPT

Surf and Turf in Season for March

___________

I will reserve the other stellar March seasonality picks for my 12631 subscribers, but you should know that I have used The PPT Seasonality feature to discover that McCormick & Schmick’s Seafood Restaurant has been a winner every single March since the firm had its IPO back in 2004. Beyond that, MSSR has an average return of 20.55% in March. While a data sample of six years is no guarantee of anything, the daily annotated chart below certainly supports the notion of another March full of good eating for MSSR longs. For your reference, I have also included The PPT precise Seasonality statistics below.

Disclosure: I have no position in MSSR.

UPDATE: Earnings on 03/01/11.

___________

Seasonality
Month Avg % Return Total # Months # Months UP # Months DOWN
January 0.326 7 3 (42.86%) 4 (57.14%)
February -3.691 7 4 (57.14%) 3 (42.86%)
March 20.546 6 6 (100%) 0 (0%)
April 12.037 6 2 (33.33%) 4 (66.67%)
May -5.728 6 2 (33.33%) 4 (66.67%)
June -1.231 6 3 (50%) 3 (50%)
July -2.979 6 3 (50%) 3 (50%)
August 4.469 7 6 (85.71%) 1 (14.29%)
September 0.414 7 3 (42.86%) 4 (57.14%)
October -3.531 7 4 (57.14%) 3 (42.86%)
November -2.757 7 3 (42.86%) 4 (57.14%)
December 0.315 7 4 (57.14%) 3 (42.86%)

___________

Comments »

Notice Anything Different?

(Below is an excerpt from a recent post inside 12631–A premium service available to members of The PPT)

_______

Unlike the past few months, this time around there is no real sense of urgency from underinvested bulls or panicky shorts to buy the dip or cover shorts after the past two days of the market selling off. You should take this change in psychology very seriously in the short-term, in my view. Although I have no doubts that we remain in a multi-year bull run, corrections along the way can be much more painful than we remember, seeing as we have just experienced a daily drip higher for the past few months that made a mockery of short-sellers.

The pockets of momentum longs are shrinking by the day, and the small cap oil names can only run for so long. In corrective markets, I tend to stay away from playing “breakouts,” as they have a propensity to fail when the market is shaking out latecomers and weak handed bulls. However, as a correction progresses, I will be looking for “support” plays more so, or names that simply are attempting to stabilize after a sharp sell-off.

While the market may pull off another v-shaped bounce to new highs, we have a proliferation of sloppy, if not broken charts, and change in market character.

Comments »

Freeport’s Dark Clouds

Here is a video that I made for members of 12631 (A premium service available to members of The PPT) at the end of January. In the video, I detail the “dark cloud cover” candlestick pattern, as it applies to Freeport McMoRan. I also believe that FCX has made an intermediate-term high, and I am looking for some more weakness, followed by a period of consolidation.

__________

[youtube:http://www.youtube.com/watch?v=a9dAI_4_wVk]

Comments »

Howard Lindzon Spotted at Jamba Juice!

____________

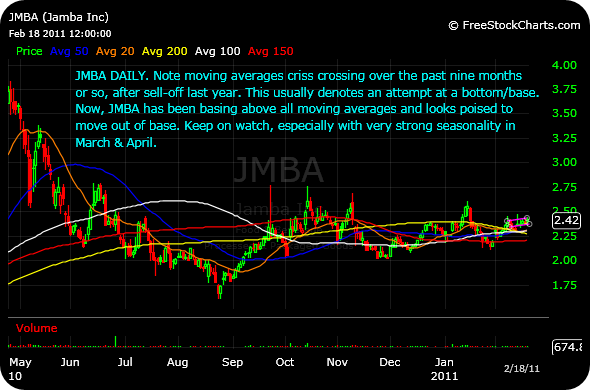
Inside The PPT, the seasonality statistics for JMBA are quite impressive, indeed. As you can see below, returns during March and April over the past five/six years have been staggering, especially when compared to other months of the year. What accounts for this? Well, the easy answer is that the JMBA business model is going to thrive in most parts of the country during the late spring and summer months. So, hedge funds are probably accumulating in March and April to get out in front of the expected uptick in earnings.

Seasonality
Month Avg % Return Total # Months # Months UP # Months DOWN
January -0.458 6 2 (33.33%) 4 (66.67%)
February -2.579 6 4 (66.67%) 2 (33.33%)
March 21.524 5 4 (80%) 1 (20%)
April 18.093 5 3 (60%) 2 (40%)
May -0.783 5 2 (40%) 3 (60%)
June -4.646 5 1 (20%) 4 (80%)
July -15.503 5 0 (0%) 5 (100%)
August 1.03 6 2 (33.33%) 4 (66.67%)
September 10.529 6 4 (66.67%) 2 (33.33%)
October -9.214 6 2 (33.33%) 4 (66.67%)
November -1.546 6 3 (50%) 3 (50%)
December -4.797 6 3 (50%) 3 (50%)

___________

Beyond the statistics, a look at a zoomed out daily chart supports the idea that JMBA is ready to move up and out of a nine month base.

___________

DISCLOSURE: I have no position in JMBA…yet.

Comments »

12631 Monthly Summary

At the conclusion of just our third full month, the 12631 Trading Group has successfully earned its place among the most vibrant and educational stock trading communities available to anyone who has the desire to improve. Our commitment to extrapolate on The PPT algorithm and improve all of our members’ general PPT experiences has enabled some of the fresh faces inside The PPT to rapidly climb up the learning curve. Beyond that, many PPT veterans have found a second home inside 12631, as our real-time chat room is literally active around the clock with fresh ideas and analysis. We also recently added real-time email trade alerts for members who may be out of pocket or busy with work during market hours.

Going forward, RaginCajun and I remain dedicated to continuing to outwork our competition by building on the combined nearly 700 posts and over 100 videos that we have delivered to our members. Above all else, we have created a trading service that has a reputation for being aggressive, yet disciplined. Our members have rapidly improved in many areas of risk management, stock selection, and fusing The PPT algorithm’s search capabilities with those sound principles.

For as little as $25 per month, the value that we offer is sure to attract even more members to our already sizable community. The only question that remains is whether you will choose to take a proactive approach and not miss out on the journey.

For more details about our service, exclusively available to members of The PPTplease click here.

Comments »

Solar Powered Boom Box

__________

The solar space is breaking out from a massive symmetrical triangle on the weekly, as I illustrate on the ETF chart for the solar industry below, TAN. Many key solars, such as FSLR, have seen notable upticks in buying volume over the past few weeks, indicating accumulation by big money. For members of The PPT and 12631 subscribers, I made a custom PPT screen that makes searching for high probability long setups in the solar space extremely efficient and effective. Click here for that screen.

__________

Comments »