12631 member “ironbird” astutely pointed out the DBC ETF in our chat room earlier today.
I wil flesh out my analysis of the weekly chart, below, after the bell on my video recap.
But you can see price leaning down against major, multi-year support.
For reference, here are the main components of the ETF (source). Note Brent at fourteen month lows.
Think it breaks down to the crash lows? Or bear traps here?
Top Ten Holdings
Brent Crude Futr May12: 13.83%
Gasoline Rbob Fut Dec12: 13.71%
Wti Crude Future Jul12: 13.56%
Heating Oil Futr Jun12: 13.20%
Gold 100 Oz Futr Dec 12: 7.49%
Sugar #11(World) Jul12: 5.50%
Corn Future Dec12: 5.01%
Lme Copper Future Mar13: 4.55%
Soybean Future Nov12: 4.38%
Lme Zinc Future Jul12: 4.16%
__________________________________________________________
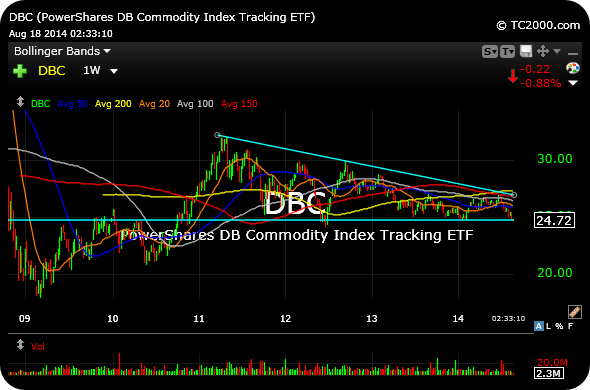


15-day ATR is twenty-cents. Almost dozed off looking at the chart.
Good point.
Believe $DCB is setting up for a bear trap. Will be on watch for a buy if new nominal lows are triggered & then reverse.
On watch, too.
Fun Fact: Commodities collapsed in summer of 1929. Jesse Livermore entered short positions in equities ahead of crash because of action in commodities and sideways action of long bull market. Rinse Repeat History.
Interesting point, thanks bluestar.
He was mostly cash from the spring of that year after a multi year run for him.