
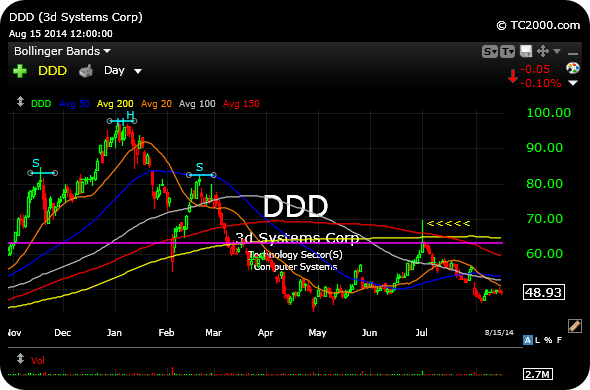
DDD is a chart which shows the concept of “overhead supply,” or trapped buyers from a well-defined levels hitting the exits once they are mode whole, working by the book. You can see the horizontal purple on the first daily chart, below. Once buyers were made whole from the last time we touched that level, they could not sell shares fast enough–This is the essence of overhead supply
Also note the confirmed head and shoulders top still very much in play for the momentum 3D printing play. The risk is still that this stock is on “the other side of the mountain,” in terms of the momentum now being to the downside.
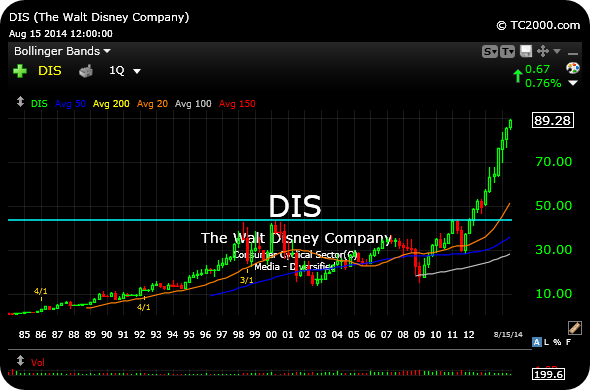
Conversely, Disney is a stock which I turned cautious on way too early. The quarterly chart, second below, shows what happens when a stock has a “blue sky” breakout, with no prior price resistance of which to speak.
________________________________________________
________________________________________________


Looks to me like DDD is rounding out a bottom. If it breaks those May lows maybe I would reconsider.
Could be–but think DDD risk still lower.
$DIS. So when “should” you have sold? ie with a blue sky breakout…whats the best strategy? sell 1/2 and stop to the cost?
Bernie,
Usually a 15-20% move off the breakout is the rule of thumb before you’d expect a pause. In the case of $DIS – Each overbought condition corrected through time and pushed higher yet. A rare circumstance to see such a strong blue sky breakout last this long especially for a stodgy Dow stock.
It’s so high up in the sky its “Frozen”.