
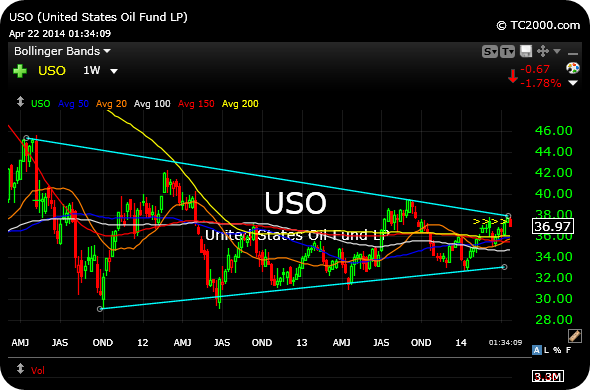
You really get the feeling, observing the crude oil ETF weekly chart below, that black gold is setting up a huge group of traders this summer.
The symmetrical triangle pattern, spanning quite some time, is highlighted and evident.
Whichever way this breaks is going to be a doozy. For now, the resistance trendline is holding with today’s weakness.
What say you about crude on another slow, grind higher in the market?
____________________________________________________________


High beta gold and silver miners up again whilst the metals languish. Hmmmmm
So far so good.
Looks like a down wave to lead up to a wave 3 of 3 or 3 of 5, either way oil is breaking $110 and if it’s a 3 of 5, yeah it will be going to like $125-$140 over the summer, at least the first month of summer.
Thanks, Bruce
Looks like $WTI wants to test $100 over the next couple of weeks. That’s my guess. Today was quite a move
Thanks, Mupp
May contract trading ends today. Likely accounted for some of the downside. However I am short from 37.50.
Going to be tough to sustain WTI above $105 short of Russia invading Ukraine. If there is a peaceful resolution over there, WTI below $100.
Without all of this geopolitical risk the past few months (Iran, Libya, Ukraine) WTI never would have gotten above $100.