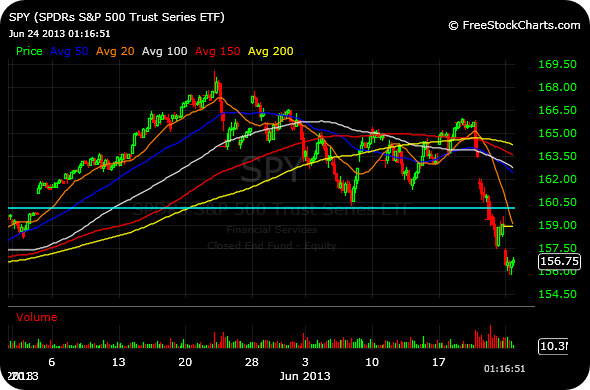
Stocks are “off the lows” as I write this. And looking at the first chart below of the updated and very stretched out hourly SPY chart you will recall that May 3rd gap we eventually filled, and then some. That gap sits up at around $160, and if this bounce has legs I suspect that will be the true battleground to determine the extent of the current correction.
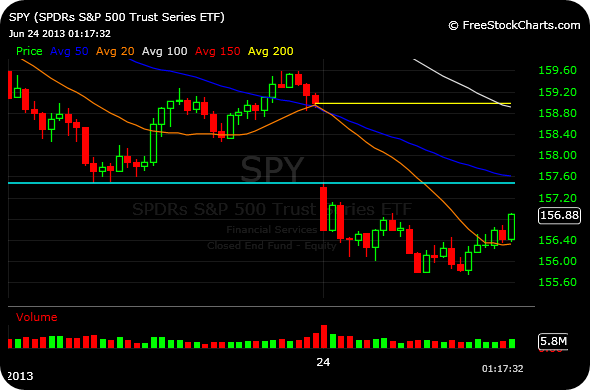
The second chart is a short-term, 10-minute timeframe of SPY.
We still have a trend day lower, albeit not at a fast clip. And if bulls can breach $157.50 this afternoon you may very well see the makings of a broader bounce.
____________________________
____________________________