
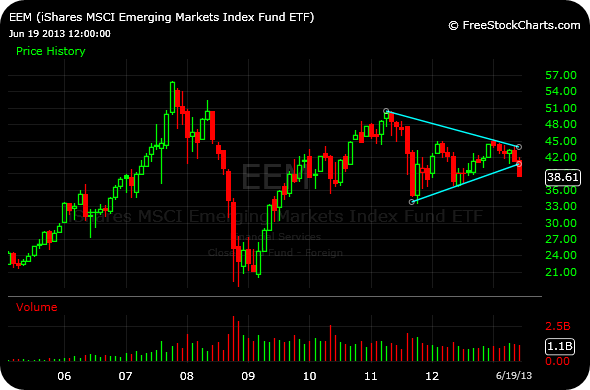
The breakout and subsequent rollover in the emerging markets ETF we looked at last month in this blog post has come to fruition in a major way. As I noted, that vicious bull trap was not unlike what we saw with gold last year in terms of the way in which both seemed to break higher from consolidation, only to give it all up, and then some. (See this follow-up post here)
Since then, emerging markets have continued to weaken, to the point where their inability to stage so much as a sharp bear market rally is concerning and leaves the door open to another wipeout lower. And when you consider the monthly chart for the emerging market ETF, EEM, first below, you can see the issue bulls have for making a case of a bottom. Essentially, they would need to see an imminent bear trap which sees EEM recapturing at least $42, by the end of June, in order to negate a nasty symmetrical triangle breakdown. If not, you can see the room below to drop into the $20’s.
Also note that even India is cracking, which was easily the strongest of the BRIC emerging market countries. I wrote this bearish piece on India a few weekends ago.
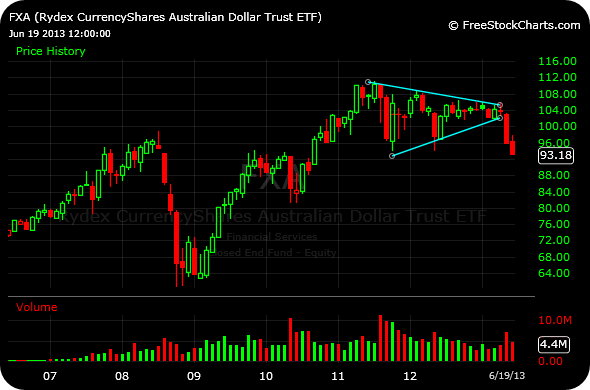
Finally, the second chart below is the monthly of the ETF for the Australian Dollar, widely considered to be a commodity currency with tight correlations to global risk appetite. Here, again, if bulls cannot show up for a last-minute save we are looking at serious damage which could easily just be starting to scratch the surface with a confirmed symmetrical triangle breakdown.
____________________________
____________________________


Round and round the capital goes. where it stops? nobody knows!
+2
Chess, what do you think of the longer term, 5-10 year, weekly chart of the mega Aussie miner, BHP?
problematic like all of them
what happened to the ‘porn star bond kind Jeff Gundlach’ post?
2nd thoughts? Did you think he’d send his hench-women after you?
It is still up.