iBankCoin
Home / 2013 / May (page 30)

Monthly Archives: May 2013

The Other Side of the Big Prayer

pictures_of_the_day_1

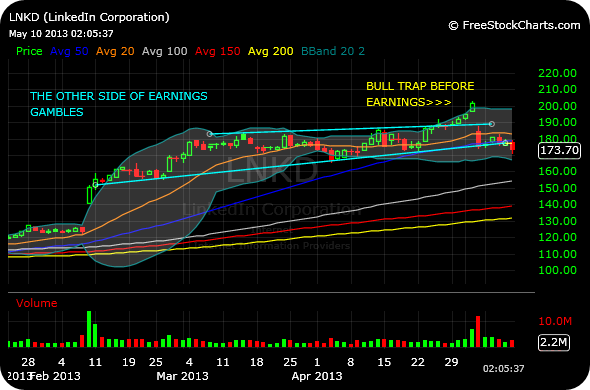
This post is not directed at those who are enjoying great wins in TSLA, post-earnings, as it is those who are beating themselves up for not betting big on the stock into earnings (or GMCR, for example). For every one short squeeze you see in Tesla after earnings, there are plenty of other times where even a strong chart deceives you before earnings and you wind up in a bull trap.

Such appears to be the case with LinkedIn. And while we may not see a full-blown breakdown on the daily chart, below, there is no doubt that longs from above $200 find themselves trapped.

As I like to say every weekend in my Strategy Session about earnings plays:

Keep in mind, there are plenty of different styles that can be profitable in the market as a trader. My discipline is to usually not hold trades through earnings reports. If you do want to hold a position through the firm’s earnings report, I would suggest that you consider lightening up the position a bit before the announcement in order to mitigate the known unknowns/risks you are assuming.

Either way, I urge you to check and then double-check your current portfolio holdings to see when the firms you own are scheduled to announce earnings. As a swing trader, I am almost always looking to significantly reduce or outright close a position into earnings. There are simply too many external variables, particular to the firm in question, from an earnings report for me to have an edge. As an example, even if you do possess some type of insider or unique information about a given firm’s impending earnings report, there is still no way to know how the market will react. Stocks can just as easily sell-off on great earnings as they can on horrific ones, and vice-versa.

In sum, there are two sides to making the big prayer or bet into earnings. At a minimum, consider reducing position size to mitigate wild swings.

_____________________________________

LNKD

Comments »

Going to Extremes

pictures_of_the_day_4

Regardless of whether or not you view it as an imminent contrarian signal, there is little doubt that certain indicators are reaching extreme levels. Obviously, if you went all-in long on TSLA or GMCR before earnings then you probably could not care less about this stuff. But generally speaking the market has been gappy, whippy, and a a bit more selective than you might expect when the major averages are pushing one all-time high after the next. That need not mean we go out and call a major top. But it does mean that playing things close to the vest is not incorrect. 

To support this notion of extremes, Downtown Josh Brown had a piece up today walking you through two of them, in particular. 

let’s just acknowledge the fact that margin debt is reaching extreme levels and just think about it psychologically – we don’t have to have a debate about whether or not this is an actionable signal.

Here’s the WSJ:

MARGIN_NS_20130509183316

As of the end of March, the most recent data available, investors had $379.5 billion of margin debt at New York Stock Exchange member firms, according to the Big Board.

That is just shy of the record $381.4 billion in margin debt set in July 2007.

In March, the level of margin debt stood 28% higher than one year earlier, a time frame that saw the Standard & Poor’s 500-stock index rise 11.4%.

The fear is that as more investors rely on money borrowed against stocks, any significant fall in stock prices will be magnified if investors are forced to sell securities to raise cash and meet margin requirements.

And then let’s briefly mention the extremes in market internals – a whopping 89% of the S&P 500 sits above its 200-day moving average. Again, let’s just be aware of this, we don’t have to debate it as a timing mechanism:

sp500-vs-sp500-stocks-above-200d-sma-params-3y-x-x-x

What I want to get across is that risk appetites are almost on full-blast.

READ FULL POST HERE 

Comments »

More on That Elusive Top

BIyzlrLCUAA6yP8.jpg-large

No. Not a top in stocks. But rather, Treasuries.

Here was what I wrote back on April 26th in this post:

Dating back to last summer, I had been looking for the TLT ETF to break lower from a massive bearish rising wedge spanning several years. We know Treasuries have been in a secular bull market, and continue to resist a major rollover even as many notable market players are calling for them to top out.

On the updated weekly chart below, also consider the potential for the bearish rising wedge to morph into a head and shoulders top (light blue lines).

Nonetheless, the fact remains that topping is a process and often a tedious one at that, with no room for ego. Beyond that, the possibility for yet another leg higher is still in play given the resilience. If bond bulls can plow up through $125 here, it will put the bear case in grave danger of being negated since the “left shoulder” thesis weakens considerably.

And here is the updated weekly chart for TLT, below. Note that last week and this week’s price candles both are sizable and solid red. We are seeing some forceful rejection away from the “right shoulder” of the head and shoulders topping pattern, or another lower high after the bearish rising wedge breakdown depending on your interpretation.

Either way, Treasuries remain vulnerable and increasingly so on the longer-term timeframe.

________________________________________

TLT

Comments »

South American Strength

epic_pictures_15

Back on March 26th I wrote this blog post discussing a pair trade of going long Mercadolibre and short Ebay. They are similar businesses, with MELI often seen as the Ebay/Amazon of South America.

With earnings now out of the way for both, the pair trade idea is actually all the more pronounced. The first chart, below, shows Ebay’s daily timeframe is vulnerable to a head and shoulders topping pattern if buyers cannot reclaim $57 with force, especially given Ebay’s prior steep uptrend for quarters on end.

Next, Mercadolibre is working through a high and tight consolidation, or bull flag, holding its earnings gap higher. When you see a powerful gap higher hold without wild price swings, it tends to indicate that the market is coming to terms with the newfound price levels in an orderly manner, even setting up to push higher yet. I would look at $123 as an upside trigger.

______________________________________

EBAY

______________________________________

MELI

Comments »

Taking the Muzzle off These Long-Term Plays

epic_pictures_7

Here are three long-term ideas that we have looked at in this blog over the past year or so. On the bottom righthand side of each daily chart, below, note that they all continue to “wake up” in terms of strong and steady buy volume after years of being essentially dead money. That bullish buy volume pattern is in conjunction with strong price action, yet none of these three charts are wildly overbought yet insofar as not touching their respecting upper daily chart Bollinger Bands.

As utilities and some of the crowded areas of the market unwind a bit, I am looking for these three to continue to make progress in the coming quarters as long-term plays.

_______________________________

DD

_______________________________

GLW

_______________________________

WWE

Comments »