
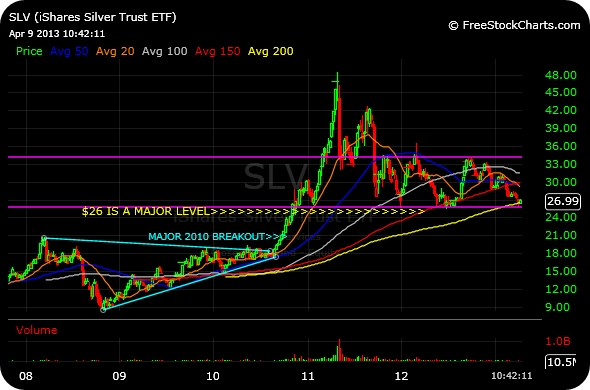
Checking in our silver charts, you can see the ETF held the all-important $26 level so far on the weekly timeframe, first below. That price area stretches back several years. And the sharp bounce we are seeing should not be much of a surprise given how ferociously the rubber band snapped to the downside.
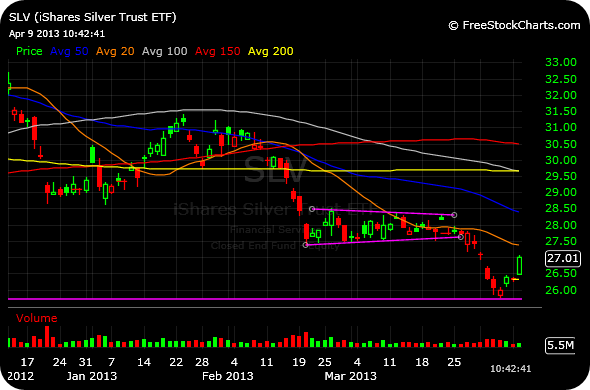
Nonetheless, observing the daily timeframe, second chart below, underwater silver bulls are far from in the clear. $28.50 is going to be a major battleground area. But before that happens, I suspect shorts will reinitiate their bearish bets if and when price reaches the declining 20-day moving average (orange lone), just above.
The first bounce off of major support is not a shocker. After that, though, subsequent tests tend to favor bears for a major breakdown. Thus, bulls must soundly recapture the initiative and prevent another rollover down below $26.
_________________________________________
__________________________________


hey chess- what is that picture of?
Genghis Khan statue in Mongolia.
Looks like a photoshop job. That building looks like the top of the leaning tower of Pisa.
here it is http://en.wikipedia.org/wiki/Genghis_Khan_Equestrian_Statue
Wow. Wow!
I bought AGQ when SLV was around 26, so intermediate-term, do you see silver acting as a haven vs equities if the market rolls over or following the market down reflecting manufacturing weakness?
I do see a reversion play, yes, but obviously $26 has to hold for that to have a chance.