
An exogenous event like the horrific Sandy Hook shootings, which occurred several days after I published this blog post in December, has almost assuredly exacerbated the short-term weakness I expected in Smith & Wesson. Nonetheless, as I pointed out in that post, The PPT Seasonality feature still indicates that January-April is an unusually strong period for SWHC.
Currently, the issue is whether the sharp correction from over $11 down into the mid-$7 range amounts to an overreaction to potential legislative pushback which would adversely affect Smith & Wesson’s business model. Given SWHC‘s rapid appreciation from late-2011 into late last year, understanding which types of charts and scales are offering the best perspective here is crucial.
As I wrote nine months ago in this blog post, using Logarithmic scales in lieu of Arithmetic for these types of stocks is beneficial for a more complete and objective analysis.
Specifically, I wrote:
On page 40 of his seminal work, Technical Analysis of the Financial Markets, John Murphy offers a graph that concisely illustrates the difference between an Arithmetic and a Logarithmic Scale. Applied to chart analysis of stocks, the key difference is that the vertical, or Y-axis, on an algorithmic price scale shows an equal distance for each price unit of change. In essence, each point on the arithmetic scale is equidistant. Most of the charts we look at use an arithmetic scale, and that is perfectly fine.
When looking at a longer-term chart, though, particularly one where price has made a dramatic move in the given timeframe, it is more appropriate to use a semi-logarithmic scale. Logarithmic scales do a better job of capturing the essence of larger percentage moves, since the percentage increases get smaller as the price scale increases. The points along the vertical axis on a logarithmic scale are not equidistant like that on the arithmetic scale.
At the time of that post, I used that analysis to surmise a bearish thesis for Green Mountain Coffee Roasters, which was trading at $43.88 then. GMCR subsequently fell to $17.11 just a few short months later and, even if you did not short the stock, you at least would have known to stay away from catching the falling K-Cup.
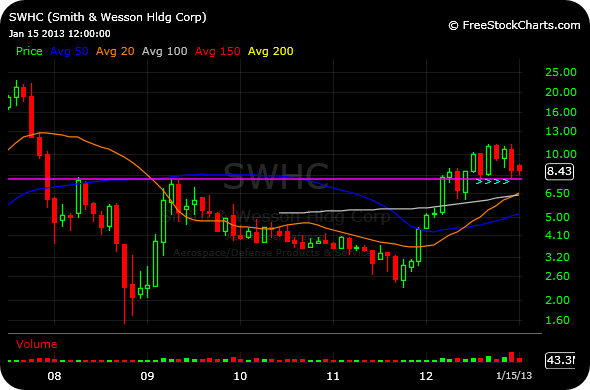
Looking at the Logarithmic scale for SWHC on the monthly timeframe (first chart, below), we can see that even during the aggressive sell-off post-Sandy Hook, price still had memory around $7.70. In other words, the purple line indicates that prior resistance from 2008, 2009, and even early-2012 was now holding as support, even during a dramatic exogenous event. Since then, SWHC has not breached those lows. Indeed, bottom-pickers of SWHC here should be trading against those December lows as a protective stop-loss.
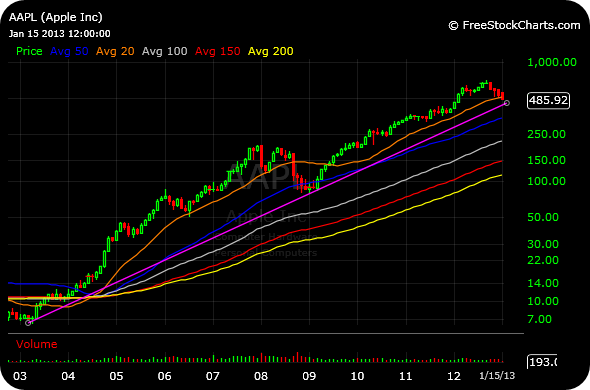
The second chart is a monthly Logarithmic Scale of Apple. Unlike Apple on its Arithmetic Scaled monthly, the more appropriate Logarithmic monthly here does not indicate a parabolic blow-off top so much as a powerful secular bull advance that is correcting. A simple support trendline dating back to the 2003 lows is not yet in danger. Furthermore, the rising 20 period monthly moving average (orange line) is only now being tested for the time since mid-2009. Thus, the Logarithmic Scaled monthly chart of Apple offers a more constructive view for bulls of the stock longer-term, than shorter-term timeframes and the Arithmetic Scaled monthly would seem to dictate.
_______________________________
_______________________________


Interesting post, Chess. Particularly the AAPL chart. Thanks!
On Apple – wonder if there are any tactical asset allocation models that will defend/preserve an investment once the 20 month moving average is breached? It’s possible to analyze Apple, do the sums, assess the news flow, look into the supply chain, etc and actually view it as, on balance, a positive story, but the dismal technicals/price action is going to force out some of the managers commonly clinging to fundamentals – there’s no tactical asset allocation model supporting ownership.
FWIW- I think that’s one of the most objective pieces of analysis I have seen in a long while. I am amazed at your ability to stay objective in all markets. Thanks Chess!
I’m liking the daily 21ema bollinger band with 2std on SWHC