
____________________________________
An old adage in technical analysis is, “the bigger the base, the higher in space.” The reasoning behind that saying is that when price bumps up against resistance for so long, eventually all of the pent-up demand materializes upon the actual breakout. A long-term chart that illustrates this point is the smart chip semiconductor firm, Skyworks Solutions. I have no position in the stock and, frankly, the shorter-term timeframes to me look quite extended. Thus, the point of this post is to examine why Skyworks should be an excellent candidate to stalk for a long after a pullback, which may or may not come anytime soon.
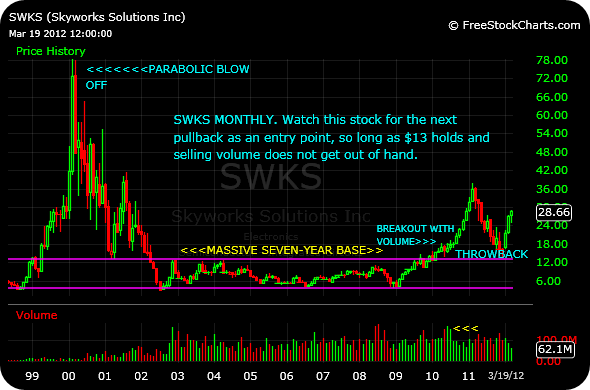
As you can see on the monthly timeframe below, Skyworks saw a dramatic run up in the 1982-2000 secular bull market’s grand finale, also known as the “Dot-Com Bubble,” largely in the Nasdaq Composite. Consistent with a parabolic, blow-off top, the stock then cratered along with most hot tech stocks, quickly going from $78 down to $2 per share in less than thirty months. From 2002 until late-2009, Skyworks then worked through, roughly, a tedious $3-$13 range.
After breaking out of the base at the end of 2009 and early-2010 with strong buying volume to support the move, the stock saw that pent-up demand come to life, as denoted by the straight-line move to the upper $30’s in early-2011. Since then, SWKS pulled all the way down to the $13-range for a near-perfect “throwback,” or retest, of its massive, seven-year base. As you can see, the backtest held true, and the presumption is that the stock is doing everything it should be doing technically to support the multi-year breakout thesis.
In sum, a stock like Skyworks can be seen as a microcosm for the long-term view of this market. Although far from all-time highs, as is the Nasdaq and many of its components after the fireworks to conclude last century, the stock has given every indication that it has sufficiently licked its wounds form the biggest, baddest bear market of them all in several generations and is ready for another sustained bull run.
____________________________________


Ah, year end 2010…
That was when Skyworks became fully sentient…
(Dum-bah-dumbah… dum-bah-dumbah….dumbah-dumbah….)
____________
When’s Judgement Day?
November 6th, 2012.
_____
TSM and INTC have similar bases and are just starting their breakouts. Peter Brandt has been blogging about TSM for a while now.