
____________
For many traders, one of the most confusing chart patterns is the bearish rising wedge. After all, how can a pattern possibly be bearish if we are seeing a series of higher highs and higher lows? Before we delve into an answer, let’s briefly recap what comprises the rising wedge.
First, rising wedges are seen as continuation patterns in downtrends (similar to the “bear flag”), or reversal patterns in uptrends. You are looking for the initial wide range of higher highs and higher lows to narrow as price converges at the apex. You also want to see at least two reaction highs (touching the upper trendline), and at least two reaction lows (touching the lower trendline). At that point, the presumption is that once the rising wedge breaks down, it will do so very quickly and retrace, or give back, all of the gains from the entire pattern. Unlike single candlestick reversal patterns, such as the bullish hammer, it is not nearly as important to wait for confirmation of a rising wedge breakdown, since once the lower trendline is broken the rate of downside acceleration tends to violently increase.
Beyond price, a lack of strong buying volume as a stock works through a rising wedge supports the bearish thesis. In confirmed downtrends, bears are looking for an overall lack of volume in the wedge to give them additional confidence that it is merely a continuation pattern before heading lower. In an uptrend, though, you are looking for signs of distribution. In other words, you want to be on watch for a situation where heavy institutional players are selling their shares to exuberant retail buyers.
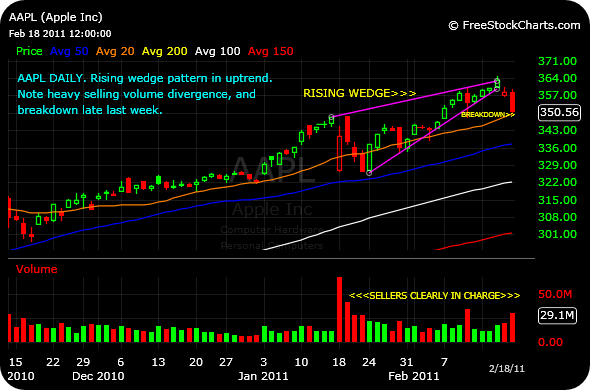
As an example, let’s take the current daily chart of AAPL. Clearly, Apple has been in an overall uptrend on multiple timeframes since March of 2009. However, over the past month there can be no doubt that sellers have been dumping shares in size, as denoted by the large red volume bars. At the same time, price has been making fresh 52 week highs, despite the distribution. Further, drawing simple support and resistance trendlines over the past month yields our bearish rising wedge pattern, from which price broke down on heavy selling volume last week. A downside price objective of $326 would retrace the entire move.
____________


Very interesting. Thanks for the continued education.
Much of what you offer could be applied to the SPY, no?
My march madness pick is apple, and I was worried about something like this. But I didn’t have time to do any charting! I’m hoping the timing will bring this back up, but if AAPL is being distributed, the market has bigger problems, I would think.
as long as qe2 is on even aapl going to 200 will not be “a problem”
the major problem of the market now are technicals , the market is running on a limit-overbought zone quite everyday , everyday ‘s been sayin that shorting the market is a waste of time/strategy/money , and till it will say so , it will be so .