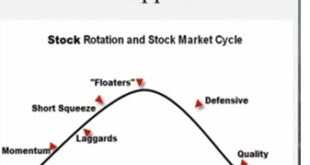
I decided to set the OAbot up so I could get a quick glance and look for themes. It was initially with the intention that I would completely automate the process, but in it’s current format the OAbot works better as a research tool than an automatic setup generator. One of the rankings looks at the average “setup score” of each stock within an industry and comes up with an average.The setup score typically (depending on the classification of each stock) will look for strong uptrends, recent consolidation and volatility compression using monthly volatility, weekly volatility, and daily move as a % of ATR).
Although there may be other valuable metrics such as relative volume of the industry and breadth, ideally the only necessary component to identifying anticipatory entries is all stocks within a group saying the same thing. I can repeat this scan across sectors or classification types, but there is an inherent bias towards stocks that are near the highs as any laggard that just exploded to new highs will then be looked at as a momentum or quality stock. As such aside from trying to subtract the recent day move from the high to see what the stock was classified as before the move, and/or having some sort of metric to track over time at what % of each group has broken out and is no longer classified as a laggard or trash near lows, there is not much that can be done… I don’t have the time to put a lot of work into the OABOT right now as I once did.
So for now we can scan for themes quickly. The following is all industries with the # of stocks in the industry over 20, an individual setup score average over 90, and sorted by avg setup score in the industry.
| Major Integrated Oil & Gas | 106.474303 |
| Oil & Gas Pipelines | 105.618511 |
| Trucking | 101.401134 |
| Residential Construction | 99.1633571 |
| Rental & Leasing Services | 98.1455953 |
| Oil & Gas Refining & Marketing | 97.1936567 |
| Semiconductor – Broad Line | 96.6590651 |
| Gas Utilities | 96.1367812 |
| Textile – Apparel Clothing | 96.0117017 |
| REIT – Residential | 94.6209923 |
| Oil & Gas Equipment & Services | 93.8425753 |
| Specialty Chemicals | 93.7406842 |
| Auto Parts | 93.4825295 |
| Property & Casualty Insurance | 93.4359768 |
| Credit Services | 93.4128977 |
| Gold | 93.3070126 |
| Chemicals – Major Diversified | 93.1052147 |
| REIT – Diversified | 92.6859943 |
| Telecom Services – Domestic | 91.2492766 |
| Drug Manufacturers – Other | 91.1494354 |
| REIT – Retail | 90.8556666 |
| Electric Utilities | 90.6886449 |
| Oil & Gas Drilling & Exploration | 90.1819049 |
| Independent Oil & Gas | 90.1435737 |
The individual setup score breaks down the stock differently depending upon the classification. Stocks near their lows are evaluated differently than those near their highs. Stocks flagged as “short squeeze candidates” are evaluated partially by their float and % of float short in addition to weightings from each category of classifications. Stocks that are liquid with good fundamentals and growth prospects are looked at differently. Stocks with accelerating momentum and growth are looked at differently. There are 3 different types of “laggards” and each has a different way to evaluate the score. The score is very dynamic in that if certain things are true it is evaluated a certain way. If either of a number of things are true, it may be given a bonus to the score. If a combination of things exceed a certain value it may contribute to the score. Should I find the time, I will put a lot more thought into the exact metrics, weightings, and components that go into the score by tracking which setups look better after making tweaks over a longer period of time until I have more ideal rankings. Once I am able to further fine tune everything, and possibly even track price across time and automate the tracking, THEN I feel I may be able to construct a tool that is more automated, particularly if I implement many of the things that are computed, but not factored into the end ranking just yet. Rather than use the OAbot individual stock scores at this time, I think it is quicker just to go to finviz and scan through each of these industries until you have enough setups or identify a theme or two that you are satisfied with.
I’ve already manually from top down analysis concluded energy was a good setup a couple weeks ago… so all the various oil&gas plays coming up is additional confirmation.
I like how trucking stocks while a very diverse group (some stocks near highs, others near lows), still shows a lot of consolidation and bullish looking setups. Look at HTLD and UACL as an example. Very different stocks right now, but both look like they are working sideways to set up a bullish move. Even among the worst stocks of the group as determined by their % off of 50 day highs are names like SWFT that are at least consolidating above a recent balance area after the sharp drop and rejecting new lows below $20 so far. Not at all a bullish chart after making the equal low longer term, but you could easily see a move to 22 before declines and recent action is at least decent considering the technical damage done to it. There are still a few stocks of the group that look like while contracting in volatility, they still have more sideways work to do for a couple weeks. I think the industry may need a bit more time for some of the leading stocks to consolidate and some of the others to work sideways or breakout and retest as the others set up, but overall it looks like an industry where you could identify a select few setups, then move onto the next, and possibly at some point you might see more of them beginning to correlate… Either way it may be a good theme to watch.
I am surprised to see residential construction score so well, I never would have even looked right now. It has been a dog of an industry but a handful of stocks are making bull flags and consolidating after a bounce from lower prices. I don’t love the industry, but every now and then you’ll see an industry flagged you wouldn’t have thought to even look at and get some ideas. It’s nice to have a preset sort of program that doesn’t have bias aside from the one you programmed in that can then be checked critically with a human eye as you have the machine that doesn’t get tired or miss anything, and then the human eye to critically assess and the intuition developed from experience (that cannot easily be programmed) to filter down the process. Since currently I am using more of an intuitive feel based identification of theme and selection of stocks, it is not a bad idea to combine objective filters such as selecting from those in sectors with seasonality that suggests we are near a low or have plenty of upside ahead.
This process takes much longer when I am analyzing it and then converting analysis to words and typing them out and it may not be exciting to read, so I won’t go through all of them. I may in the future just look to create only a volatility compression score only as being able to limit the search to groups with plenty of volatility contraction may be a little easier, particularly if I combine with a decent overall setup score in the way that it will filter down the groups to those over 85 or 90 rating first and then will sort by volatility compression scores.
the end for now.
If you enjoy the content at iBankCoin, please follow us on Twitter