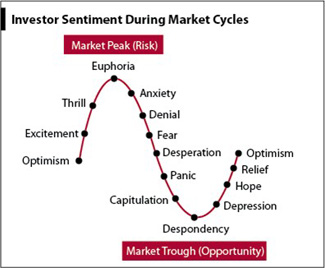
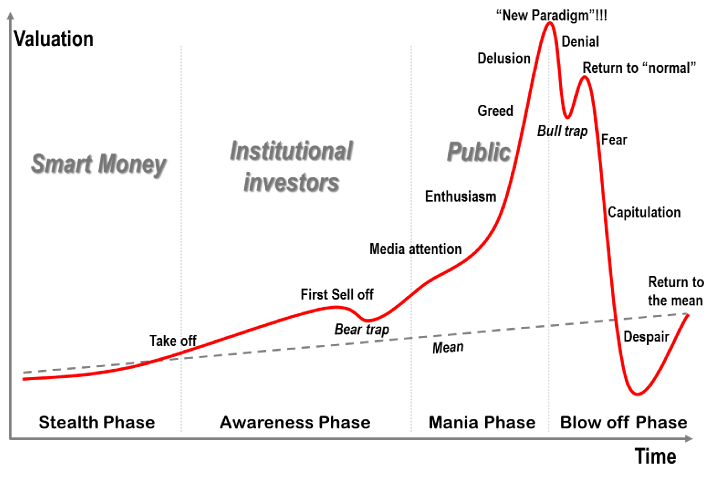
The human nature of man is to avoid pain (loss) and seek pleasure (gain). This is an inherent trait that causes individuals to make irrational decisions. We try to make the best decisions but individuals are prone to biases due to emotion.
One of the ways the market reacts to conditions is to look for confirmation of existing emotions and beliefs and ignore information that contradicts those emotions. When collective emotional extremes are met that creates a mispricing due to the way human nature seeks to swing from avoiding pain and seeking pleasure.
One layer of how markets climb the “risk ladder” is the longer term generational time frame shift from savings and bonds to stocks. This is a very, very long process as you can see by the history of 10 year interest rates.
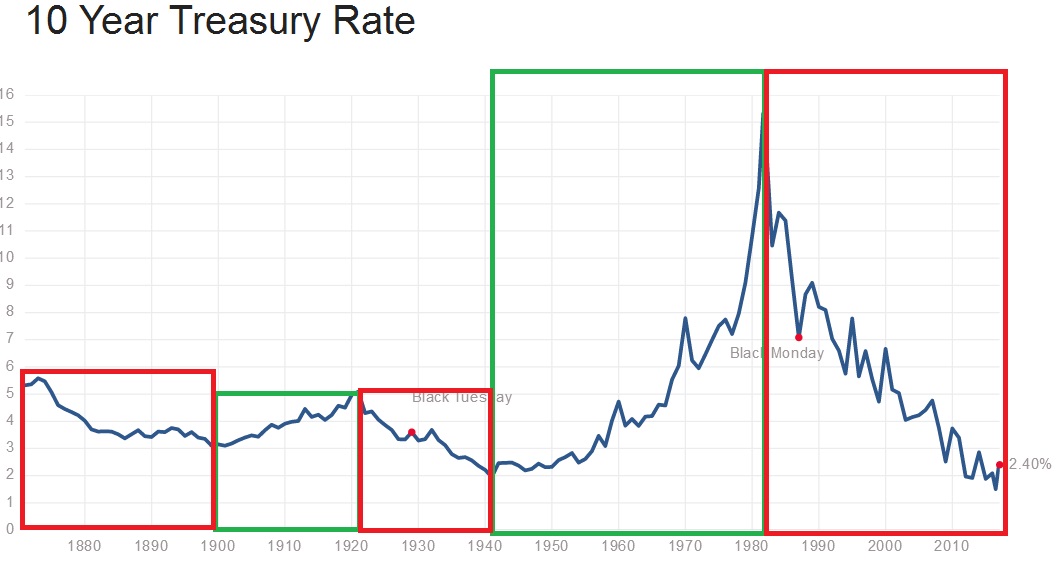
Note that because assets are priced in relation to each other and the total amount of capital and credit available changes, drawing anything in isolation based upon where interest rates are is probably not a great idea. Speed or rate of change and trend may tell you something about the conditions of the market, but not the pricing itself. Interest rates compared to valuation metrics of the market adjusted for inflation and compared to pricing mechanisms of other assets can potentially tell you which assets are being neglected and which assets wealth has concentrated in. But the point of the illustration is to get an idea of the time frame and to understand how capital shifts and interest rates change.
Side note: There are generations of investors and traders who have never really experienced an uptrending rate of interest rates. That’s the pain trade because a declining number of people have experienced it as market participants, especially from the low point like in 1940’s and 1950s. That requires you to have been in the market for 65-75 years
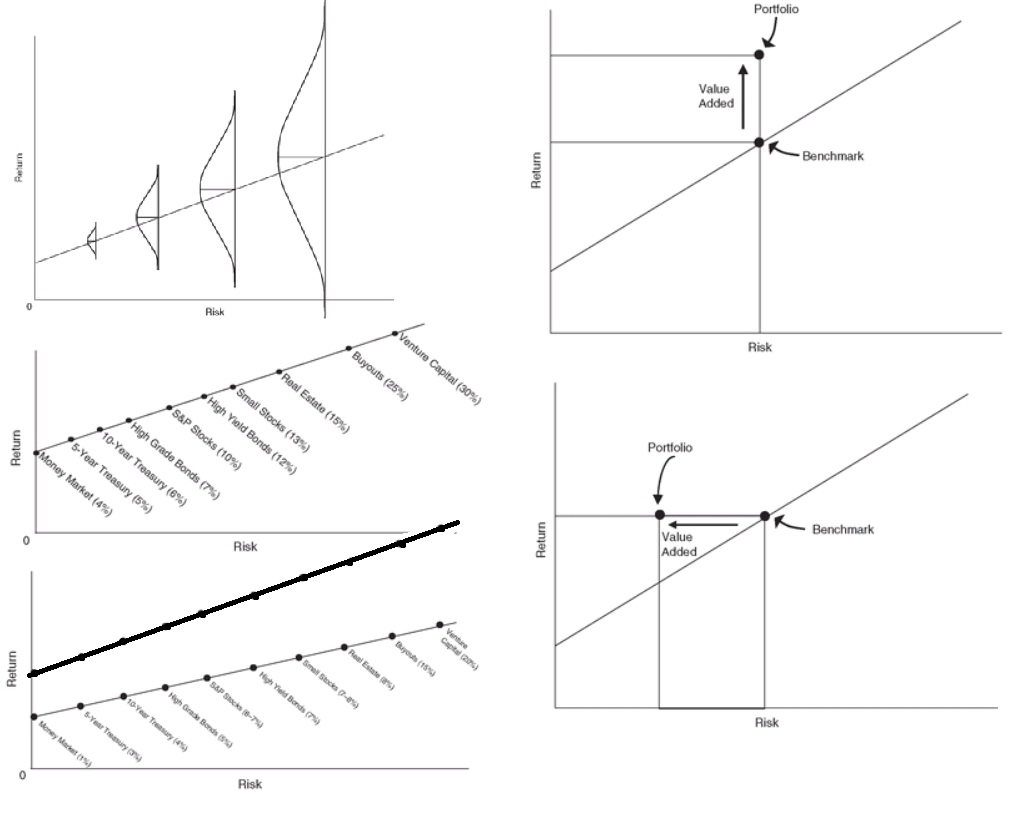
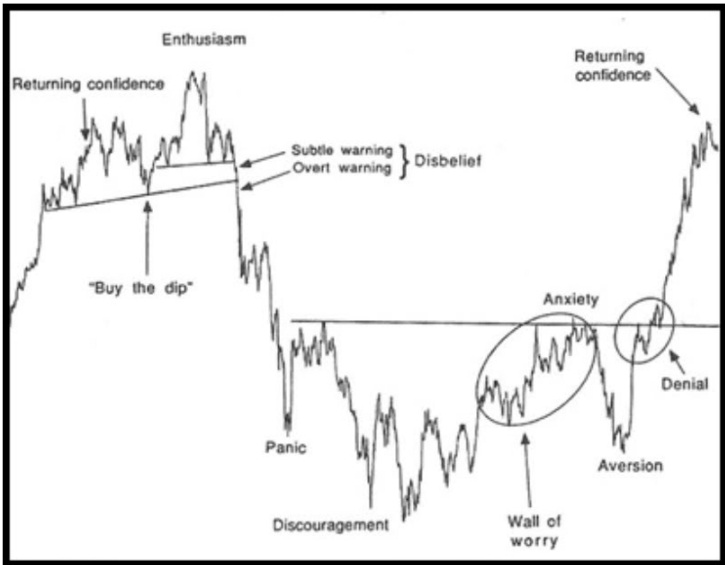
This image is more of a mostly “efficient market” graphical representation (with normally distributed mispricings). I believe there is more of an irrational component. When stocks are underowned and based upon emotional fear of loss, they represent lower risk AND higher reward. When stocks are overowned and priced based upon a manic seeking of gains, they represent higher risk AND lower reward. I believe the markets swing from extremes not only adjusting to interest rates, but also adjusting to the emotional component and using confirmation bias to rationalize their choice after the fact.
It’s not that people make rational decisions, it is that they like to think of themselves as rational creatures who are in fact behaving totally irrational most of the time. Rationalization is the explaining away of a thought in a way that seems legitimate enough to satisfy the ego. Their precious egos won’t allow themselves to think humans are incapable of seeing truth as it is so we literally invent ways to think acting according to our emotions is justified.
Sometimes emotions align with rational decision. For example, someone feels good when they get a good deal so they may choose a lower priced item when the decision is not complicated and there aren’t different features. Or they may avoid the emotional annoyance of traveling too far away to get a better priced one and it happens to be financially better. But when emotion is involved and there are multiple variables, you can be sure that a lot of people will make the emotional decision over the rational one.
Take for example valuation investing. It seems totally rational to invest in securities with the lower P/Es. It seems totally rational to avoid the markets where the P/Es and P/Bs are high. But I think it’s a mechanism to rationalize herding.
Imagine there’s only $1,000 in circulation because of a huge deflationary vortex. Earnings have mostly gone negative and companies are going bankrupt. The P/Es are either enormously high or negative. Is it rational to buy? According to the “logic” of P/Es it is not rational at all. However, you have the stocks that everyone has been forced to sell and the economy where deflation has kicked in and maximum fear. My irrational filter that says everyone is irrational most of the time would say this is a great time to buy because everyone else is acting irrationally. And in fact 2008-2009 is a great example of when emotions ran high, deflation set in, Lehman went bankrupt and Bear Sterns was bought out for $1 per share. Then price action lead the way higher after several bear market rallies convinced people that there would only be short lasting bounces.
Now let’s say the opposite. The markets have totally inflated future growth expectations as well as most of the current earnings are due to a massive capital concentration into the US. Because of all the capital inflows, there are businesses raking in the cash as people have the highest amount of disposable income they’ve ever had. But the disposable income is based upon cash and credit available due to an inflated market. So any valuations that seem rational are not. Certainly in 1998-2000 there was a period where irrational got more irrational in internet stocks. No longer were prices driven by institution, but instead by the masses crowding into the idea. Because of a history of valuation no longer mattering, and the thesis that the internet would change the world economy (yes eventually it did but only after 15 years of pain) that people convinced themselves was rational, we had a period that extended beyond.
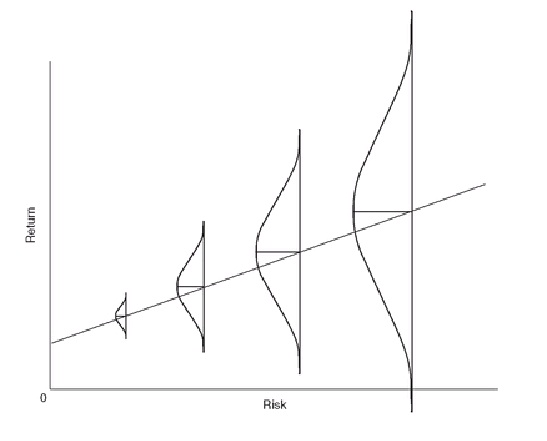
I also believe that at a certain point risk looks more like this:
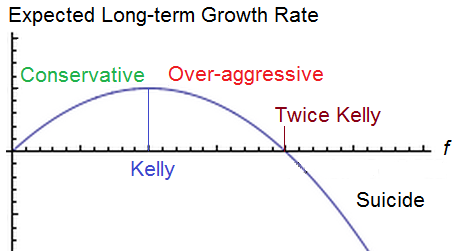
But that’s more a component of how you construct your portfolio than the availability and pricing of market securities. You can take the highest risk assets (like stock options) and make them work if you position size correctly. However, this also applies to global economies and how capital is allocated across the world. Initially increased allocation in riskier assets is healthy for a market. But there’s a certain point where allocation is too large and capital concentration becomes a liability, particularly as participants seek risk. Pushing prices to a point where it takes increasingly large percentage of the world’s capital to support it is what results in major tops in assets.
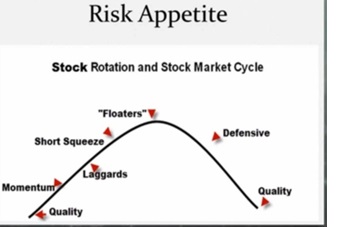
But this climbing of the “risk ladder” occurs on different wavelengths of time and correlates to sentiment.
I am working on slicing up the market into different layers to see what is consolidating. I also want to look at breadth of these ideas in the future to see what is happening now as well as what is setting up. I’ve noticed a bit of a shift happening where the scores have improved in the higher float short %. You can’t necessarily see it completely since I haven’t given you the context of history and while I’ve seen each update I’ve made I haven’t been able to show you how it has changed over time. But anything with a consolidation score above 500 seems to be where there are still stocks worth considering, although it usually seems like only the historically volatile names with the lower scores matter and the lower beta names seem to always score well due to how I’ve constructed the score. Some of that also has to do with the financials and transports and others making a large move and the rest is comparably less volatile than the move in Novemeber.
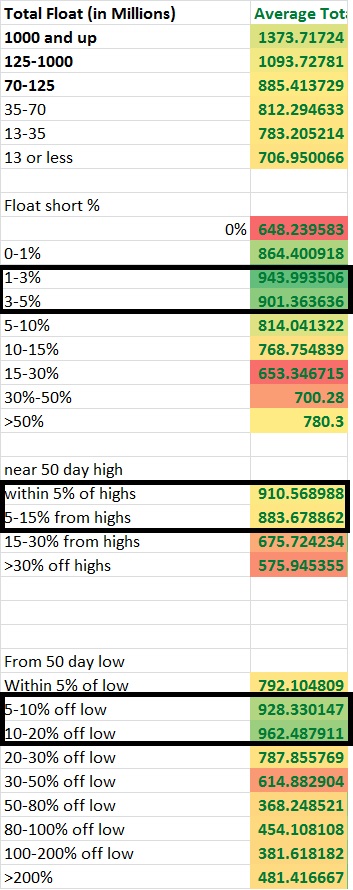
So far it seems the market is not quite ready for the highest risk stocks, but I have noticed a shift taking place that’s hard to really articulate. It seems that stocks near their highs are coiling (possibly for a second leg up) while the stocks that have sold off and are near the lows are starting to set up while the stocks that have really advanced off their lows have either been resting or have been behaving more wildly, it’s hard to really say without combining the date with performance stats. Meanwhile the market has gained an appetite for slightly higher short interest names and the low float stocks that were once not at all showing signs of consolidation are starting to consolidate more than before.
I’m hoping development of indicators like this will allow me to get a better feel for what’s working, what’s setting up, how the market behaves, and ultimately what’s next.
There is another big project ahead in the future of automating the risk classification of stocks. I don’t know the details but stocks near the highs, higher float, higher market cap, lower short interest, greater institutional ownership higher profit margins and ROE, more consistent earnings, positive earnings and less beta and lower volatility on the long term time frame with a positive trend will provide sort of a “risk profile” and average “risk” level which then can be adjusted by sector and industry average and compared relative to the sector and industry average as well. I want to spot more in detail how the market goes through this risk cycle and when each layer is setting up. I want to look at sectors by risk cycle and look at the consolidation score, and of the industries with enough qualifying stocks I want to identify the setups by risk level and performance by risk level. I want to know what specifically to set up for and whether or not I can identify themes.
If you enjoy the content at iBankCoin, please follow us on Twitter

Goddamn, that was good! Great post
Great read.. Thanks!
Awesome keep us in the loop!
Whoa. I like where you are going. sweet.