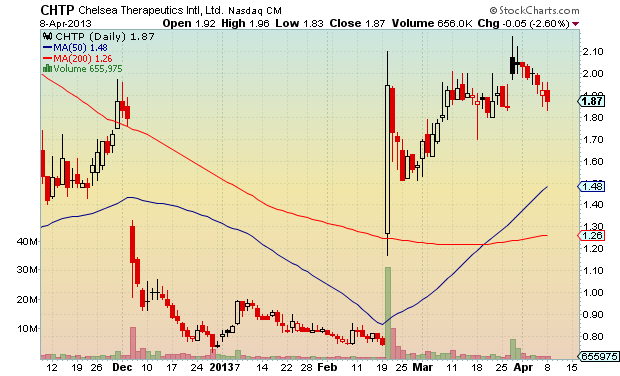
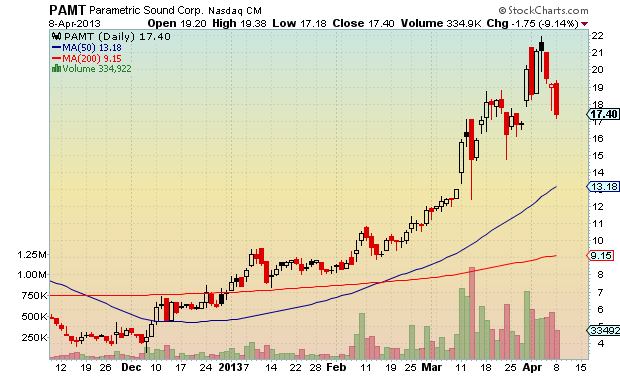
Well we got the new highs necessary to keep the bears at bay. Yesterday’s move gives the all clear signal for the high tight flags.
They are linked to stockcharts, for your viewing ease.
Comments »I am not yet officially bearish, but I am near to it. Neither breadth nor volume is confirming this latest rally, and while we could certainly see new highs, any stalling or consolidation is likely to lead to a small to moderate correction. Most traders are sitting on decent profits for the year, seasonality is looming large, and I get the sense that there is a skittishness developing. Failure to make definitive new highs I believe will push skittish traders into the fearful category.
All that being said, it is nice to have a quiver of setups in a confirmed downtrend to jump on when the time is right. I have linked each symbol for ease of analysis.
Comments »
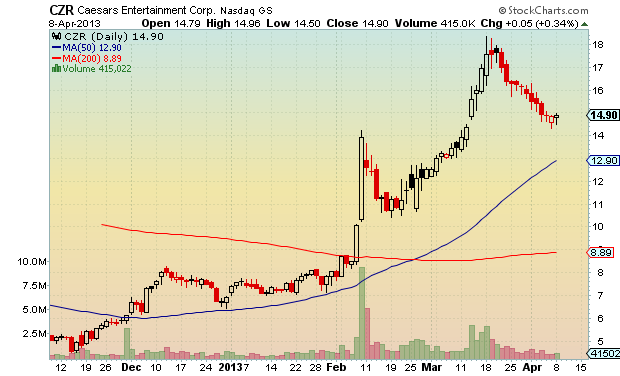
None of these are new to tonight’s screen, but they are all still valid. The recent market consolidation has held the reigns tight, keeping these from running anywhere too fast. I still like the orderly pullback that $CZR is completing.
Do Valuations Matter for Practical Market Timing? No.
Kaeppel’s Big Vs. Small Strategy
Exploiting the Low Volatility Anomaly
State of Trend Following in March
All of these articles, and more, can be found over at The Whole Street: Quants.
Comments »Some interesting ones, for sure…
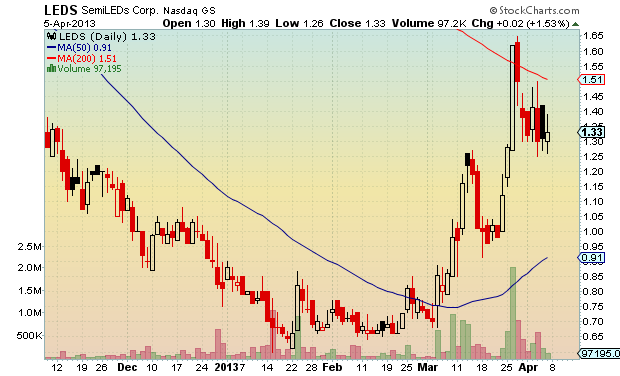
Truly, a much longer term chart of $LEDS should be examined. If this stock is beginning a new run, it could be an easy double or even a 4 bagger before encountering major resistance.
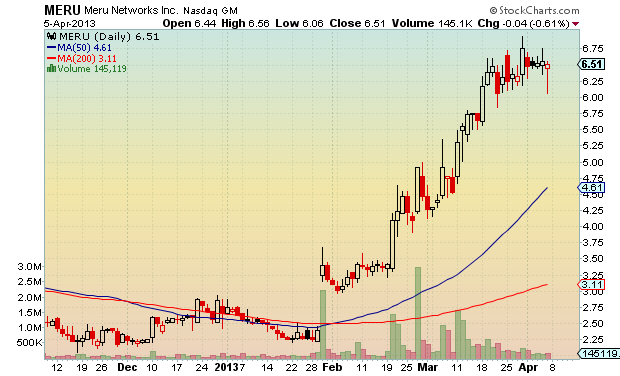
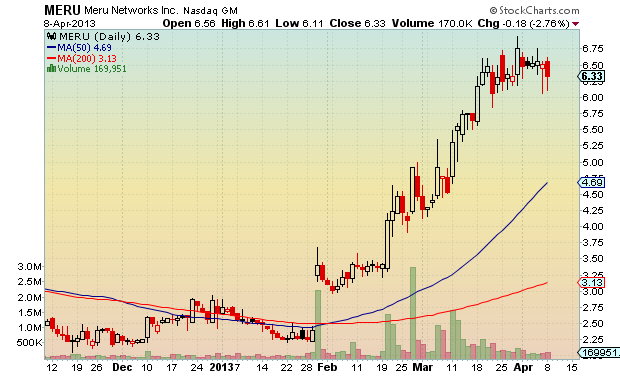
$MERU has also been in a long, long downtrend and may have put in a bottom.
Comments »It is official. Using a proprietary ranking system, the top ranked Fidelity sector fund is Utilities. With the S&P and Dow Jones sitting near new highs, having a defensive fund ranked number one is a blinking yellow caution light.
Here are the top five Fidelity sector funds:
I remained concerned that there are two transportation funds in the top 3, which might mean the system is subject to over-concentration in a particular sector. We’ll have to wait and see how things turn out. The system has held both FSAIX and FSRFX for longer than 30 days, which means each can be sold as soon as they drop out of the top 3.
Comments »The previous article, Long Term Investors Crazy Not to Sell in May?, we examined a basic Sell in May and Go Away strategy. This update will add an additional factor to the strategy, which is to use the 200 day simple moving average to keep the strategy out of the S&P when it is in bear market territory.
The Rules:
Note: I spent some time trying to find data for a bond index which would allow me to go back farther than 1996. I did not have any luck. If anyone knows of a suitable government bond / credit index (or mutual fund tracking such an index) with accessible data going back farther than 1996, please let me know.
The Results:

The top pane is $SPY. The middle pane is the equity curve for the strategy. The lower pane shows the drawdowns in percentage terms. The blue portions of the equity curve represents time in $SPY while the green represents time in VBLTX. Compared to the basic strategy, adding the 200 day moving average requirement keeps the system in VBLTX for significant amounts of time.
Statistics:
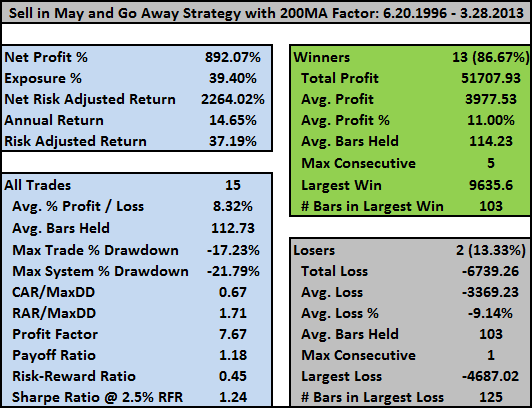
Because of the way I coded his, all the trade information pertains only to the $SPY trades. The returns from VBLTX are built into the overall returns but are not considered to be trades.
If I subtract out the added return from VBLTX, the annualized return from just holding $SPY is 10.69%.
$SPY buy and hold over the same period is 5.26% with a maximum drawdown of -56.47%. So even if you do not rotate into a vehicle to provide a return on your cash, you still double buy and hold just by selling in May.
Historical Profit Table:
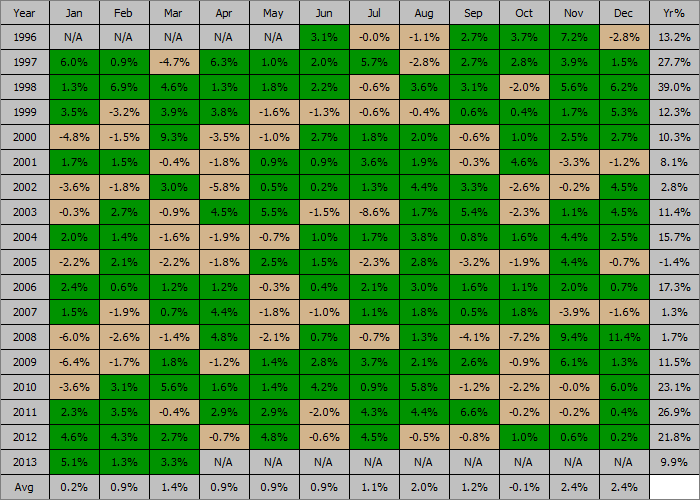
The strategy has performed unbelievably well, any way you slice it.
However, I have my doubts going forward. They are best encapsulated in a comment left by Kill The Banks, in the previous post:
I think there needs to be some evaluation of bonds as an appreciating asset class going forward. There was some blogoland chatter a few months ago regarding the “max theoretical gain” left in bonds (forget if it was the 10yr or the 30yr) and that number being around 17% total net or so (IIRC). Sentiment seems to be that given the current interest rate situation the only direction rates can really go is up, which translates into “bonds down”.
Me, I’d be wary of the forward usefulness of any methodology incorporating bond longs that has good backtest results.
With that comment in mind, what would we rotate into, if not for bonds? Is there another asset class that should be considered during the May – October seasonal period?
Comments »