iBankCoin
Home / Woodshedder (page 8)

Woodshedder

Checking in on the Caveman Rotational System

I first wrote about this system on February 2, 2012, in a post entitled A Rotational System So Simple a Caveman Could Trade It.

I’ve run a test of in-sample performance (results below). Do check the above link to get the system rules. For those of you who are lazy and just skim this post, the system trades the Fidelity Sector Funds. My aim is to build a portfolio of ETFs and run the system over those, with an update on how this works out, in the near future.

Results since 2.2.2012:

  • CAGR:                                        16.03%
  • # of Trades :                            22
  • % of Winners:                       81.82%
  • Avg. % Profit/Loss:              2.56%
  • Max. System Drawdown:  8.82%
  • Sharpe @ 2.5% Risk Free: 1.22

Equity Curve:

Caveman Equity Curve

Flat areas of the curve mean the system was in cash.

I know we’ve been in a bull market, but this performance is not too shabby. Buy-and-hold CAGR for $SPY over the same time period is 13.99% with a maximum drawdown of -9.69%. The Caveman System has beat both the buy-and-hold annualized return and drawdown.

I’ll be re-examining this system in the near future.

Comments »

Why You Shouldn’t Stress About the S&P 500 Closing Beneath its 50 Day Moving Avg.

The 50 day moving average is important in that it calculates the intermediate trend of any given financial instrument. A close beneath it means that we watch to see if the intermediate trend is slowing. Multiple closes beneath the average likely means the intermediate trend is not only slowing but in danger of rolling over and becoming a down trend.

So today’s close beneath the 50 day moving average could be very important, or not. In this case, it is really not that important.

The reason it is not that big of a deal is because the S&P 500 had been trading above its 50 day moving average for 74 days, before closing beneath it.  74 days above the 50 day average means the trend has been strong. Yes, it is likely now slowing, but we shouldn’t expect for the momentum that has been built up over those 74 days to come to a crashing halt.

Perhaps a visual would better demonstrate what we should expect to occur…

The Rules:

  • Buy $SPX at the close after it has traded above its 50 day moving average for at least 74 days and then closes beneath it.
  • Sell $SPX at the close X days later.
  • First $SPX trade is on 12.7.1928.
  • No commissions or slippage included.

The Results:

74 days above the 50 MA

This setup has tended to generate almost double the average return of buy and hold over a 50 day time frame.

And sample size, while not huge, should be large enough for the results to be considered reliable. There were 38 trades made (add one more for the trade made today), and all of them were able to be held the full 50 days. 74.36% of those trades were higher than the purchase price, 50 days later.

The buy-n-hold results were generated by cutting all $SPX data into 50 day segments and then averaging all of those segments.

The Bottom Line:

Momentum is powerful. It does not typically just stop overnight. While I believe the current trend is slowing and we are likely to see a correction, there is still time to adjust. Trends do not turn off and on like a light switch, yet we often use moving averages to turn off and on our trading strategies.

Comments »

Fidelity Sector Funds Rankings Now Even More Defensive

Below are the top 5 ranked Fidelity Sector Funds.

  1. FSUTX (Utilties)
  2. FSAIX  (Air Transportation)
  3. FBMPX (Multimedia)
  4. FIUIX (Telecom and Utilities)
  5. FBIOX (Biotechnology)

We now have 2 defensive funds in the top 5, and I guess one could make the argument that Biotechnology is a somewhat defensive play. I’m not sure how to characterize Multimedia.

The ranking method is proprietary. Holding the top three funds for a minimum of 30 days and then selling them if they have moved out of the top 3 and replacing them with the new top funds has generated a return of 11.6% YTD against the $SPY return of 10.5%.

Since 2007, the system has generated a compound annual growth rate of 16.41% with a maximum drawdown of -12.42% against the $SPY return of 1.62% with a maximum drawdown of -56.47%.

Comments »

Not Important Really, But Breadth Suggests Short-term Bounce

I’m struggling what to write tonight, or even whether to write at all. When dealing with loss of life and tragedy, the markets really don’t matter all that much. Still, today’s action was somewhat historic, and so I struggle.

I’m going to try and find a balance by just posting a few graphs and making a few comments about the graphs and leaving it at that.

4_15 Breadth

The graph above has 3 breadth indicators: one that is very short, one that covers a week or so, and one that covers an intermediate term.

The middle pane with the green line shows a percentage rank of the number of stocks that have declined. Note that it is at 100. Obviously it can’t get any higher. Readings above 90 are good for an immediate bounce.

In the lower pane, the red line shows the number of stocks trading above their 5 day moving averages. It closed at 319. A reading of this level is associated with a bounce that can be sustained over a period of days or even a week. Although this reading is very low, I’m not sure if I trust it since the influence of the Boston tragedy is hard to quantify.

Let’s look at another suite of breadth indicators.

4_15 Multiple Breadth Measures

These graphs are based on Stockbee’s Market Monitor. I’ve coded them over the past month or so in order to backtest them. I’m not going to write a great deal about them tonight, but I will highlight the big divergence in the first pane under the $SPY graph, which shows the number of stocks up more than 25% or down more than -25% a quarter. This divergence is a huge blinking yellow caution light.

Secondly, notice today’s first peek of yellow in the middle pane, which means there were more stocks today that were down more than 25% this month than up more than 25% this month. Another warning sign.

So what I am seeing is the likelihood of a short-term bounce, but I do believe the market is entering a corrective phase.

I offer my thoughts and prayers to those in Boston.

Comments »

Backtesting the SPY 10 / 100 System

The simplest ideas are often some of the best. This is a mantra that should often be repeated by traders and investors. The simplest ideas persistently produce profits for long periods of time. I don’t know if this is because they are so simple that they are ignored or because they identify and exploit the structural architecture of markets.

With that thought in mind, I was recently reading a newer blog, Don’t Talk About Your Stocks. This gentleman wants to trade trend following systems but is relatively new to backtesting and system trading. I can identify. I have a keen memory of where I was and what I was doing when I first read Covel’s Trend Following. Similarly, deciding that I would no longer trade discretionary patterns but would instead follow quantifiable, rules based strategies, was a defining moment in my development as a trader, investor, and system designer/tester.

So the SPY 10/100 System is his first attempt at following a rule-based, quantifiable, trend following system. The only problem is that he can’t backtest it. That is a huge handicap, as it certainly stinks to have to paper trade a system for a few years before realizing that it would have worked or didn’t work. Because I like simple ideas and because I can absolutely identify with his desire, I am going to backtest it for him.

We shared a few tweets and I was able to discern the rules for the SPY 10/100 System.

The Rules:

  • Buy SPY at the next open after the 10 day simple moving average closes above the 100 day simple moving average
  • Sell SPY a the next open after the 10 day simple moving average closes beneath the 100 day simple moving average
  • I have not included any commissions or slippage. All SPY history was used for this test.

The Results:

SPY 10 100 Equity Curve

Upon first glance, the equity curve and drawdowns both look promising. It fared well during the Armageddon trade of 2008 but has missed some of the rally from 2011 to the present.

Let’s dig deeper into the system’s statistics:

SPY 10 100 Stats

The 5.73% compound annual growth rate did not beat SPY buy and hold which was 6.58% over the same time period. However, the buy and hold drawdown was significantly worse at -56.47% against the 10/100 system maximum drawdown of -35.81%. Since the system does make many more trades than buy and hold, once commissions and slippage are factored in, results would be worse. Note too that trading the open is hard to replicate using all but the most expensive data packages because of how the opening price is reported by the exchanges. I would feel safer replicating trading at the close.

Let’s look at the historical profits and losses:

SPY 10 100 Profit Table

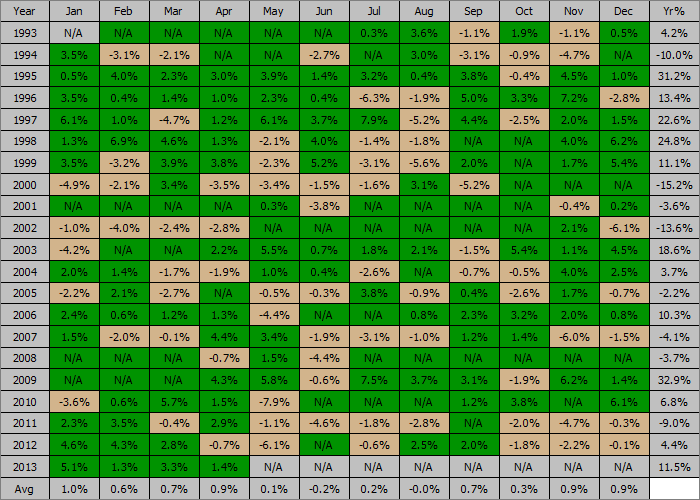
As the stats show, and as the author indicated, this is a trend following system. This means we can expect the system to take many small losses and gather fewer large wins. Over time, the large wins make up for the many small losses. This should be intuitive. Markets do not trend all the time. Small losses are taken until the market embarks upon a strong trend.

Reading about a trend following system can be awe-inspiring as 20 years worth of profits can be encapsulated in one graph. From experience, trading such a system is entirely different. It can seem like a lifetime when the system is whip-sawed over a year or so before it catches another winning trend. Perhaps this is another reason why these simple system can endure over time. Most people can not trade them consistently and long enough to significantly erode the edge.

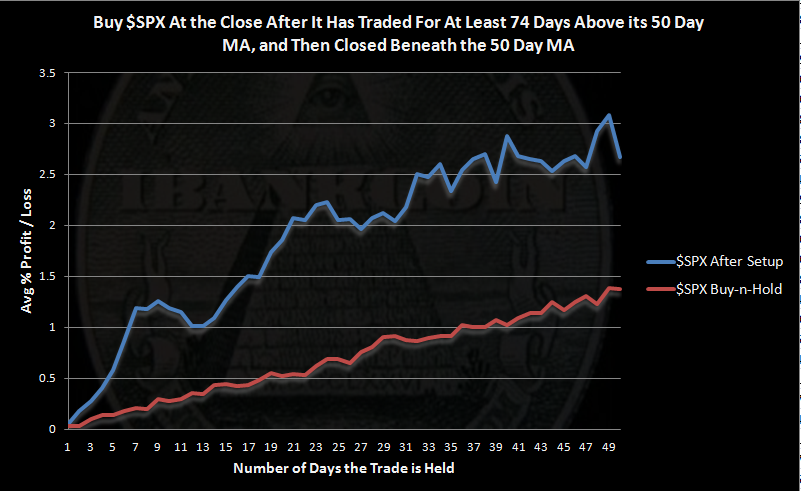
Profit Distributions:

SPY 10 100 Profit Distribution

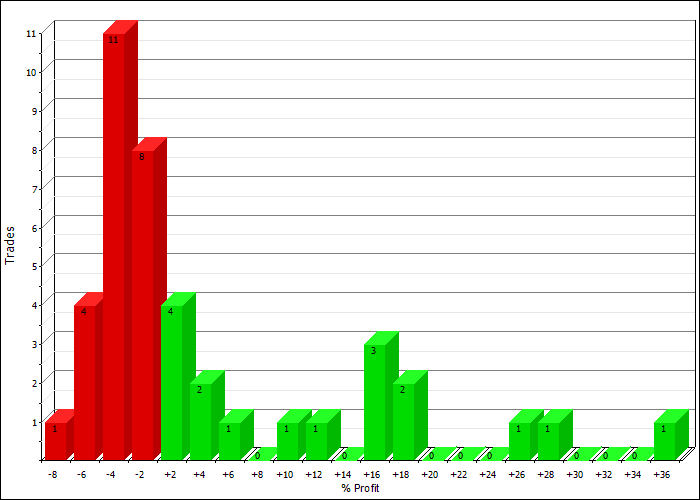
I included this graph because it shows the typical trend following system profit distribution: Many small losses with fewer large wins.

The Bottom Line:

Overall, the 10/100 system is viable in that one is not likely to lose his starting equity if his life saving were to be thrown into it. If the goal is to beat buy and hold and decrease the associated drawdowns, the system is not viable. It does occur to me though that trading the SPY 10/100 system may be a good way to start trend following or system trading in that it is like learning how to ride a bike with training wheels…You can’t go very fast but you have some protection against crashes.

One final note. I backtested the system to 1928 using the non-tradeable S&P 500 index, and the results were remarkably similar to those above. This tells me that this system is not likely to break down or get much better. It will over and under-perform depending on the differing market regimes, but over time the performance should remain remarkably average with the benefit of decreased drawdowns.

Comments »