It is fitting and appropriate that my first post at iBankCoin.com will likely appear on a very volatile day for the U.S. equity markets. While I had hoped to post a chart of a great breakout or a sick-looking breakdown, the current market environment requires an alternative inaugural theme. Ultimately, I have posted a breakdown; it just happens to be the Nasdaq Composite.
Technical Analysis, which will be the focus of this blog, is sometimes considered to be a tool for prognosticators and a crutch for the lazy and ignorant investor. Whatever value traders assign to Technical Analysis, it can be indispensible in helping us to understand what has happened in the past. Once this is understood, it becomes logical to consider future scenarios which we can then determine to be either ordinary or extraordinary.
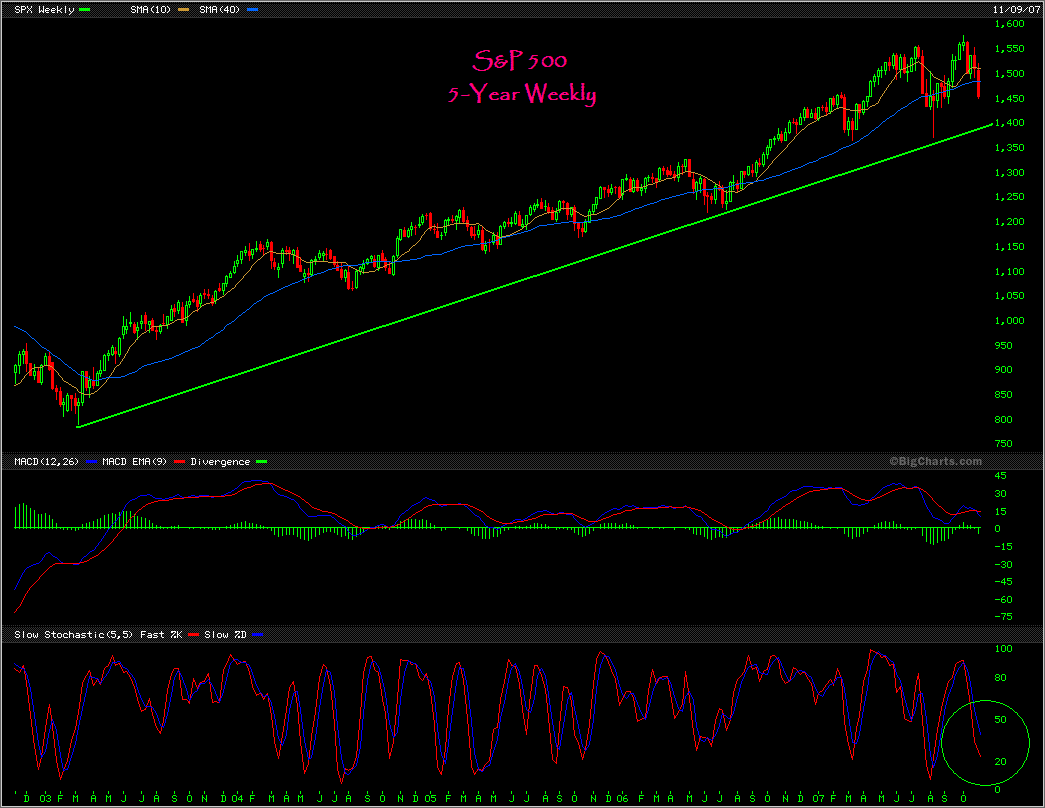
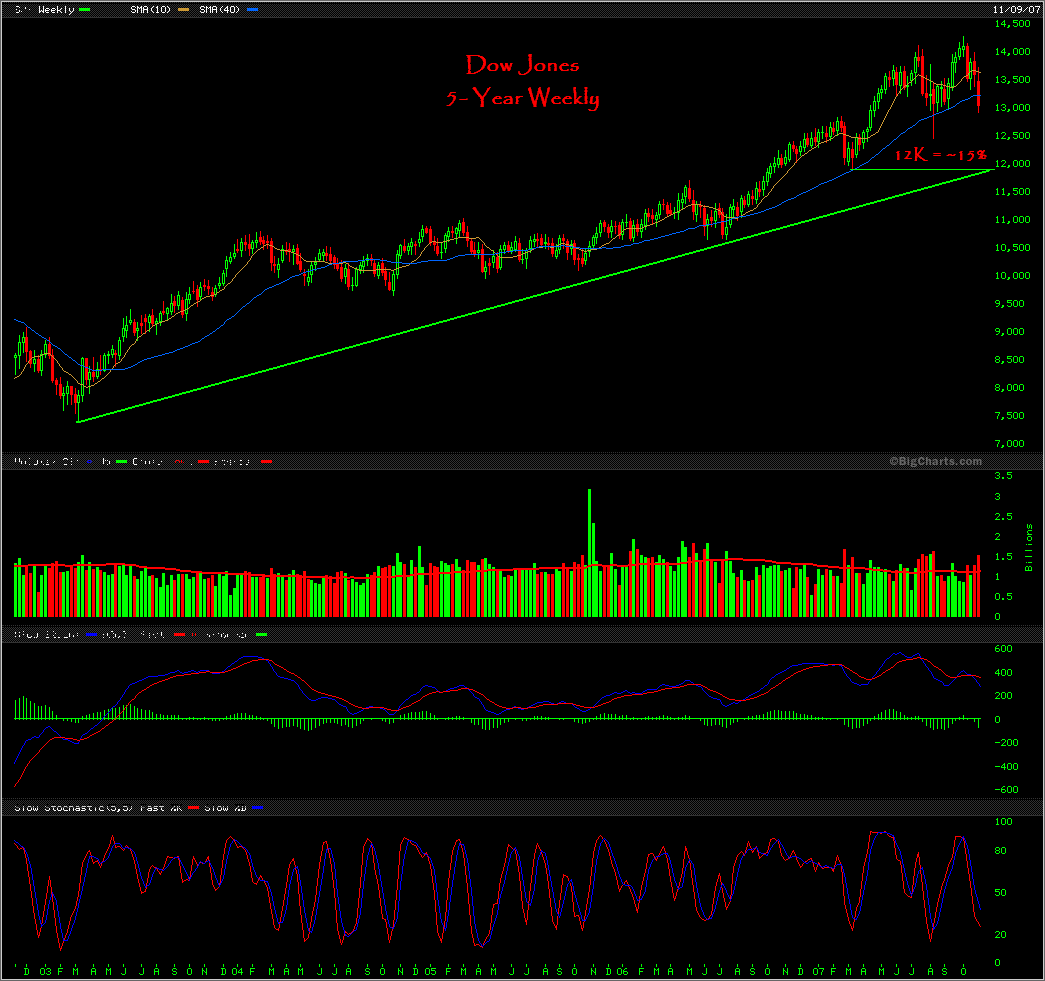
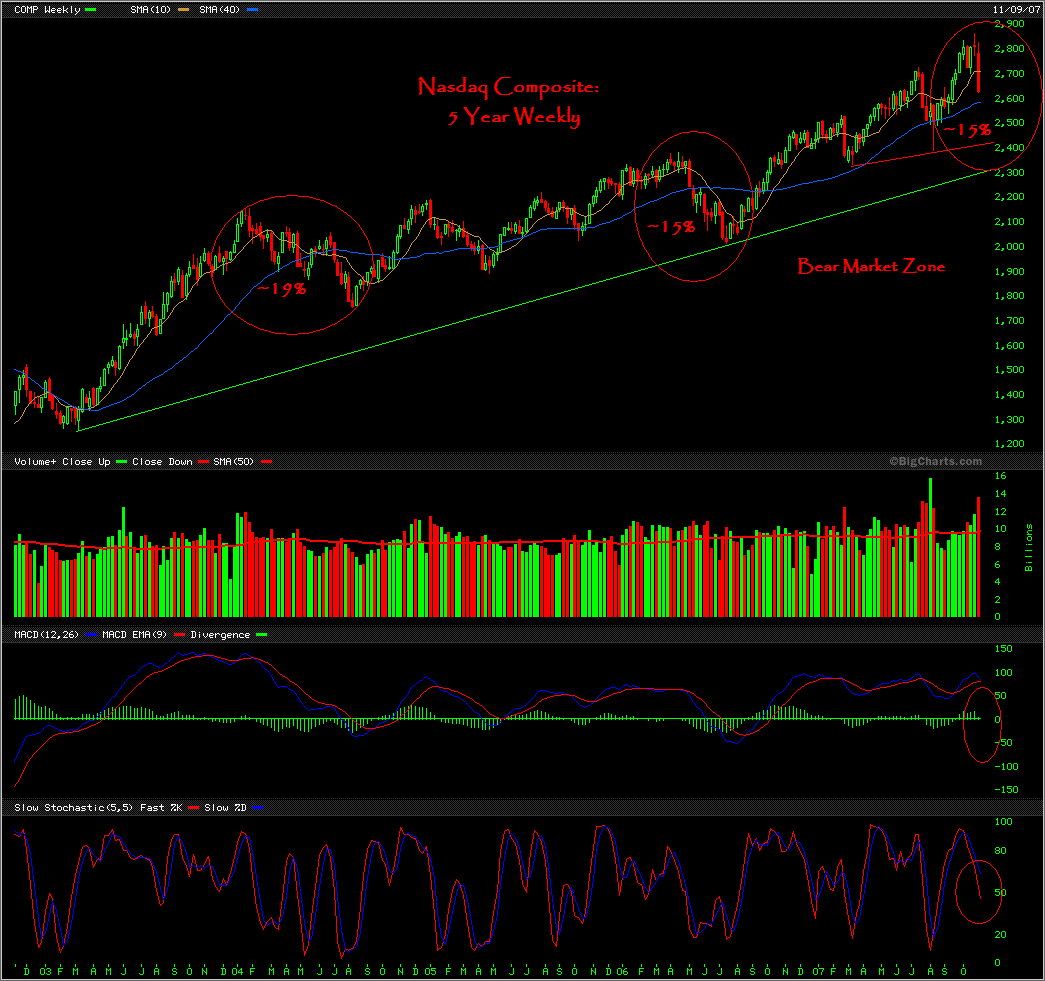
To that end, let us examine a 5-year chart of the Nasdaq Composite. Note that the 5-year time span is not arbitrary. After the tech bubble blow-up, the index bottomed in October 2002. Since then, the Nasdaq has been making higher highs and higher lows. For 5 years, the trend has been orderly with regular upswings and pullbacks.
 With the chanting of “Bear Market” and the daily write-downs of billions of dollars by the financial industry, it is easy to assume that this most recent correction is more severe than those of the past. Actually, while the beginning of most corrections are very violent, the recent action in the Nasdaq is not particularly alarming or out of the ordinary. At least not yet.
Consider that from May 2006 to July the index underwent a correction which shaved 15% from the peak value. Most traders likely do not recall any particular catalyst which led to the decline. I know I do not remember anything in particular about that period of market history, except that maybe Bird Flu was going to bring about the armageddon du jour. Who remembers the correction of January 2004, which lasted 8 months, and dissolved ~19% from the Nasdaq? What was the catalyst?
The point is that these corrections are normal. And while they seem like big news at the time, in retrospect they are often nothing more than a blip in a large uptrend. While understanding that perspective can provide longer-term traders with an edge, shorter-term traders need to consider whether the latest correction catalyst (sub-prime loans and the credit crunch) is significant enough to cause an event which may be determined to be extraordinary, relative to the 5-year trend. If the latest catalyst can be quantified to be more or less significant than previous catalysts, an edge may be developed by positioning accordingly.
If this is a normal correction, it would follow that the Nasdaq may pullback to the area of 2430. A move to that level would constitute a retracement of ~15%, and would be ordinary relative to the 5-year trend. It would also place the index at support levels generated from the pullbacks in March and August of 2007.Â
However, should the Nasdaq break the long-term trend line established from the October 2002 and July 2006 lows, the move will be extraordinary and the index will be in the bear market zone.
Comments »