I have followed this system for 3 years now, and have traded it live since February 2012. I am happy with its performance and will keep trading it.
2012 Results, buying the first trading day of January 2012 and holding to December 31st:
- Net Profit = 8.47%
- Max Drawdown = -10.06%
- Risk Adjusted = 10.93%
- Number of Trades = 20
- Avg % Profit / Loss = 1.32%
- Winning % = 50%
However, if the system had been traded in 2011 and those open trades held into the beginning of 2012, then the compound annual return for 2012 is 11.8%. With $SPY doing 11.7% for 2012 (not including commissions or slippage), I find this return to be very respectable. Keep in mind that there are no commissions or slippage generated from trading Fidelity Select Sector Funds.
The system is very simple to trade and is sustainably traded by just about anyone with a Fidelity account and about 30 minutes a month of free time to devote to it.
The system is currently long the following funds:
FSHOX (Construction and Housing)
FSPCX (Insurance)
FSAVX (Automotive)
Here is a link to the funds the system trades: Fidelity Select Sector Funds
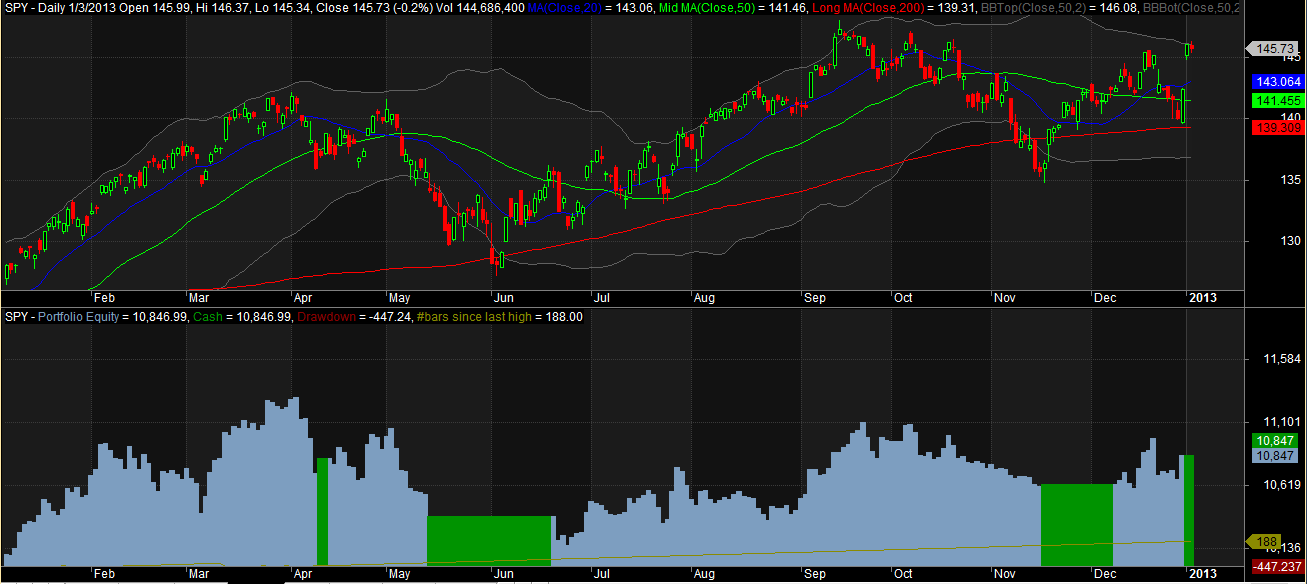
Equity Curve: Click on chart to enlarge…
I am honestly excited about continuing to trade this system, and if you have ever traded a system for any length of time, you understand how hard it is to feel comfortable enough to trade it by the rules and still enjoy the process.


I see a lot of similarities here to the system I’m using. It’s basically “rebalance once a month to ETF with highest relative strength”…with a few more bells and whistles. I like it because it’s really hands-off and when implemented properly (i.e., following the system exactly as I should) it typically outperforms the market.
Good stuff.
Yeah, I’ve got one of those too that uses ETFs. I need to dust it off and see how it has done with a year or so of in-sample performance.