Introductory Post: Dip Buyer’s Dilemma: Sometimes You Buy the Waterfall
2nd post: Dip Buyer’s Dilemma: Identifying the Waterfall Trades to be Filtered
I’ll assume the first two posts have been read and cut straight to the chase.
I’ve added a lower Bollinger Band (50,2) to the system and changed the rules so that the system will not buy $SPY even when the decliners indicator is greater than 80.
The test is going to run from 1.1.2007 to 10.4.2012. The first graph is of baseline system performance where $SPY is bought at the close when the decliners indicator is greater than 80 and sold at the close 10 days later. The baseline performance includes the waterfall trades as identified here. The second graph shows performance after the Bollinger Band filter has been added.


As predicted, the Bollinger Band filter reduces performance. However, it does lower the max trade % drawdown and the max system % drawdown. It also reduces the total number of trades by 25 which lowers exposure significantly.
But does the filter keep the system out of the waterfall trades? Let’s look. In the interest of transparency, I’ve included all the trades made. The list is long. The trades highlighted in yellow were on the original waterfall list and were NOT filtered out.
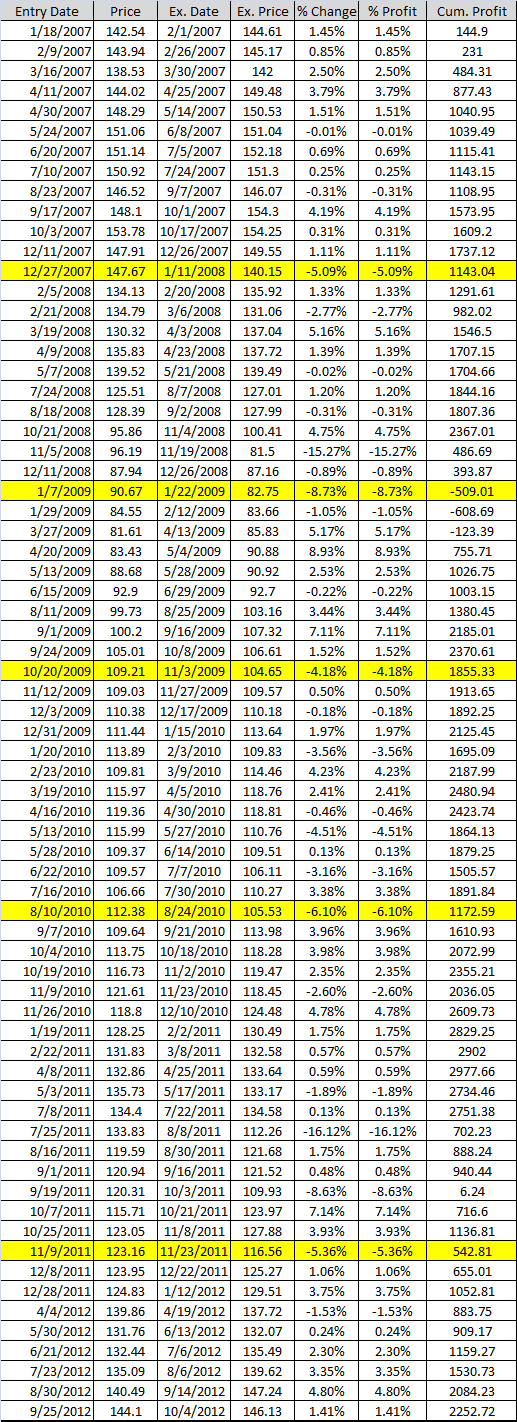
Below is the original waterfall list:

Using the lower Bollinger Band filter eliminated 7 of the 12 waterfall trades. However, a quick scan of the trade list shows that the system added other waterfall trades. Just scan the % Change column and look for the large losing trades.
While adding the filter did eliminate more than 50% of the waterfall trades, it hurt performance overall (as predicted). To see how much the filter hurt the system, just compare the two equity curves.
With Bollinger Band Filter

Without Bollinger Band Filter

In the next post I’ll apply another popular filter.
To be continued…


This is excellent analysis. Thanks for working through this.
No problem Vimal. Glad you are finding it helpful.
Good stuff, Wood. Interesting idea with the Bollinger Bands, I would have thought there should be an improvement. Kind of a shock to see it go the other way.
I’ve been experimenting with filtering based on volatility. Volatility seems to have some persistence, so I have a bit of hope it might work, but it’s been tough because volatility has such a wide range. It’s a very sensitive indicator. Maybe I’ll try the BB idea on volatility 🙂
Thanks! Would be interested to know more about how you are using volatility to filter.
I’ve been playing with taking the standard deviation of SPY over a rolling past one month period, and reducing exposure as that number rises. (I don’t know if VIX type stuff could work instead – I’m using realized volatility, while VIX is based on implied volatility.) It’s calculated in Excel as part of a big optimized matrix, so I can’t really say how high the volatility has to be before exposure goes to zero. It appears to be around 10 or 20 times more sensitive than other indicators like RSI. The key seems to be checking if volatility is rising or falling, rather than just an absolute level (i.e., the derivative is more important). I have no idea if this is possible in the software you use – maybe compare it to last weeks reading?
Without the Bollinger Band filter the draw downs are more manageable for any kind of leveraged system as well.
The system does well except for the Armageddon trade of 08-09.