There is plenty to cover after such an eventful week. I was thinking that short-term breadth would be extreme, but it is not, and longer-term breadth has not improved as much as I thought it would.
Click the chart to enlarge…

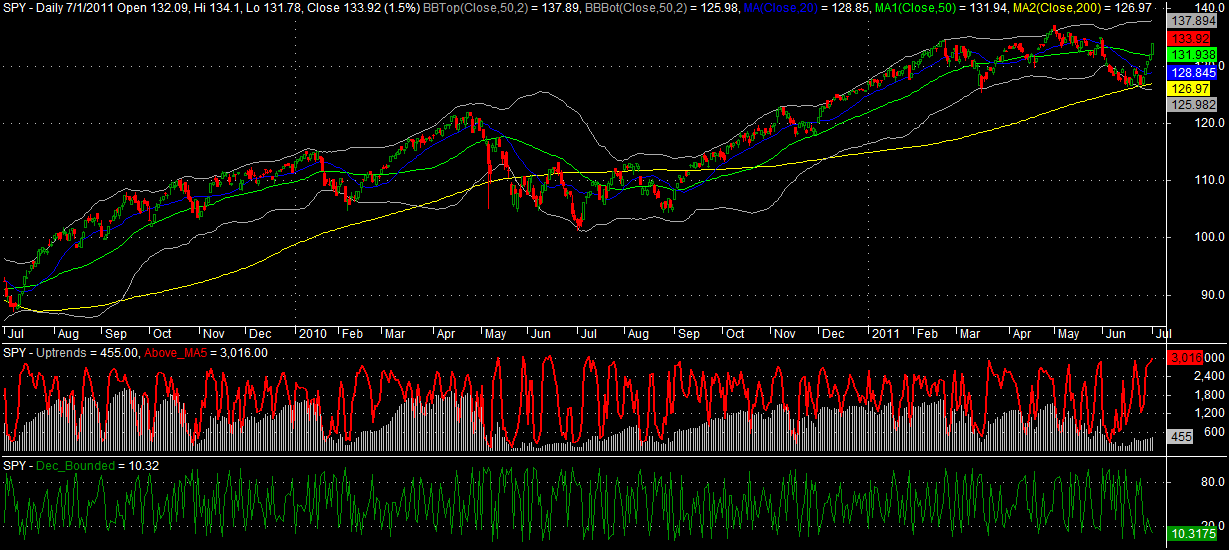
The red line shows the number of stocks above their 5 day moving averages (MA5s). I assumed this indicator would be off the charts. It does show a high reading of 3016, but I would not call it extreme. There were 4 instances of this happening in 2010.
A ran a quick study to test what happens when this indicator hits high readings.
The Rules:
- Buy SPY When # of Stock Above Their 5 Day Moving Averages is More than 3000
- Sell X Days Later
- No Commissions or Slippage
- Test Dates: 7.1.2008-7.1.2011
The Results:

There are sample size issues with only 4 occurrences of > 3000 (with Friday counting as the fifth occurrence) and only 16 occurrences of > 2750.
- As the chart above shows, there appears to be a bearish edge with the reading > 3000, while lowering the threshold to >2750 shows a neutral to slightly bearish edge.
- Looking at the chart of SPY, the green arrows show the > 2750 trades. You’ll see there are examples of the indicator hitting high levels while the market keeps chugging upward.
I could take this type of study back further in time, but I would have to change the code to see just the percentage of stocks above their MA5s, rather than the raw number, and I just don’t have time to do that this evening. Perhaps a project for the near future.
The other indicator that gives me some concern is the gray histogram which shows the number of stocks in an uptrend. I consider this indicator to provide an intermediate-term glance at market breadth. With SPY near 52 week highs, this indicator is depressed (a bearish divergence). I look at this indicator as a reflection of whether or not the market has a stable foundation beneath it. Currently, the footing is not as stable as I would like it to be. With this in mind, I believe it is safer to bet that we will see a pullback and some mean-reversion due to the high number of stocks above their MA5s. In fact, give a good look at the chart. You’ll notice that the red line shows larger swings when the gray histogram is depressed.
Bottom Line:
As much as my short position will not like to hear it, the market could go higher here, although I do not believe the foundation of the market is strong enough to support a continued move higher. For this reason, I believe the market will be subject to the forces of mean reversion, and we will see a pullback. I will treat any pullback as a buying opportunity.

