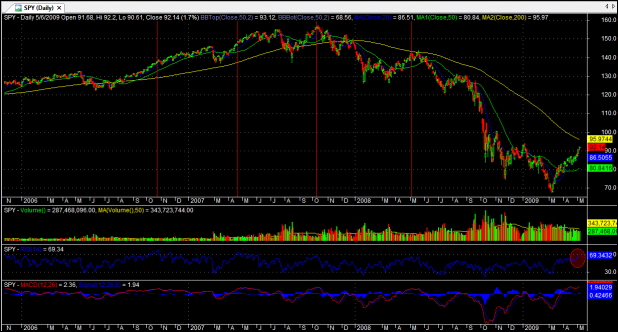
I have read that the standard Relative Strength Index setting of 14 is not very predictive, but I have never tested its effectiveness for myself. However, I was messing around with AmiBroker’s charts and noticed that it appears that RSI(14) has been effective in marking intermediate term tops.
The red, vertical lines mark RSI(14) peaks over the last 3+ years. The current reading is highlighted with a red-tinted oval.
I think it is notable that the current reading of 69.34 has not been achieved since April-June of 2007.
I will create a study soon to test the accuracy of RSI(14) for forecasting market turns.


Wood, For what it’s worth. I still use RSI(14). For bottoms: lower low in price and higher low in RSI(14). For Tops: higher high in price, and a lower high in RSI(14). Daily charts with tweaked bollinger bands. It works OK for me ( +21.53% YTD), but it’s not like CA’s returns.
My question is “would it be effective for empirical reasons or because a great deal of traders would believe it to be”.
Case in point – Fib retracements. They work because a huge portion of the trading market believes them to work.
My $.02 would be to test the whole range of RSI levels from 2 to some nonsensically high number like 200 and use some sort of empirical grade (such as ChiSquare or the like) to find the correlation between that indicator and a profitable trade.
Cuervos, That’s a good 2 cents. Maybe I’ll take it on as a project.
Cuervo, I have done some testing across various strategies and up to this point 2 has been the best setting. I have not tested past 10.
As for empirical grades, I have used net profit and average trade, although win% might offer some insight.
I’m not sure that when using RSI over a variety of strategies that a ChiSquare relationship would mean much, except for the strategy which it was tested on.
Cue,
what BB setting are you using, can u give some more info.
The use of RSI will depend on the time frame selected. For one minute you may want a more pronounced reading of 9-13. WFC, JPM a great stocks for RSI or Stochastic. There is a correlation between full stochastics at extreme levels of 5-90 and RSI being 70-80 and 30-20.
These are very effective when properly used for me at least..
John
Thanks for mentioning time frame John. That is crucial. I’m primarily interested in the dailies as I trade EOD for the most part. But you are right, adjust RSI settings for the time frame.
One more thing for now..
Different Specialists, market makers, etf’s, stocks and sectors may trade differently. One thing I have been working on (for the last week and have about 2 hours in) is the establish the highest accuracy rate when back testing.
An example is if 5 minutes on WFC being long may yield 12-1 for back testing. This would probably be true for JPM and the ETF XLF. Then you may find the higher returns from the 30 minute chart and need to to modify the RSI so since everyone is looking at the same thing.
Since trades and black boxes trade a lot of the same items can you can get to know your friends fairly quickly. Nothing is 100% and knowing when its over or under valued helps. I havent noted all the the levels but with the RSI and full Stochastics youve got a real good change of being okay in the trade. 60 minute, then 15, then 15, then 5 and 1 and reverse depending on short or long entry.
http://stockcharts.com/h-sc/ui?s=WFC&p=60&b=5&g=0&id=p93131106497&a=163236707
“adjust RSI settings for the time frame.”
Can someone expand on this?
Does one lower the RSI on a short or long time frame and vice versa.
Thanks.
@bill
BB?
I was simply waxing theoretical to Wood about how I would go about framing an experiment into this indicator.
I tested several RSI settings with long over 47 or 50 and short below. It worked great from 1978 to end of 2002 and then not so much after that. This was on the Nasdaq.