Un-scientific observations noted here piqued my curiosity as to what RSI period setting is the most predictive. Over the next week I will be running some tests in order to determine which RSI settings are predictive and which ones might be discarded as useless.
First I will look at using RSI as an overbought indicator.
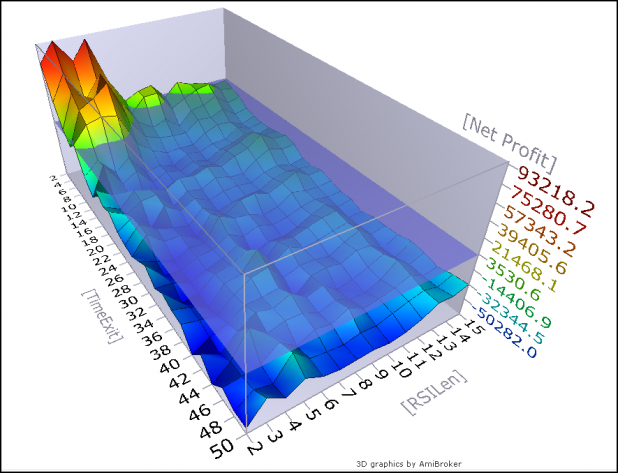
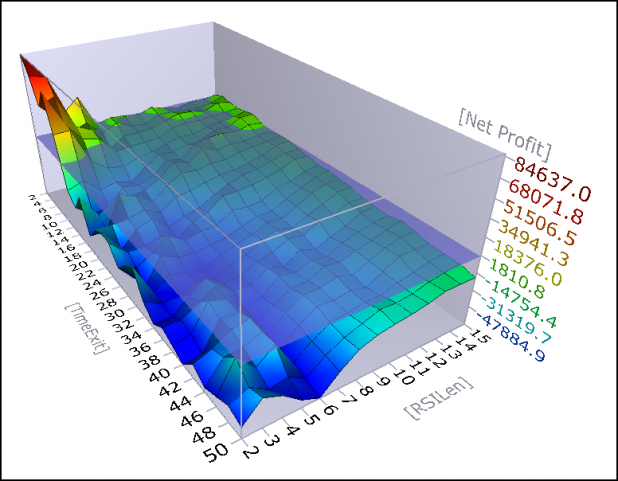
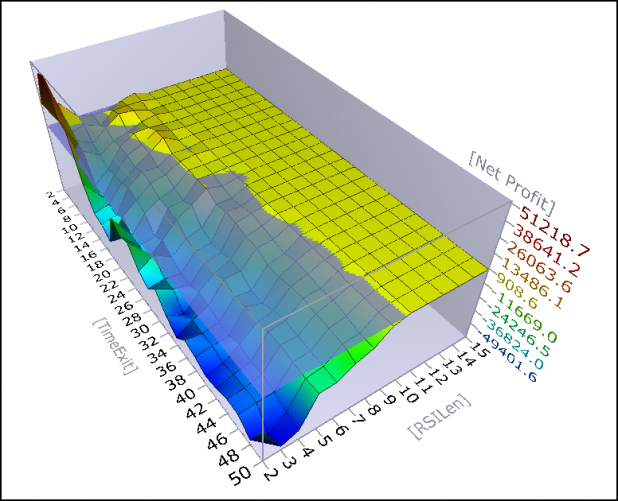
As 70, 80, and 90 are commonly used as upper boundaries on RSI, I ran a test for each of these levels.
Parameters:
All short-sells and buys-to-cover were executed on the open of the day following the buy/sell criteria being met. For example, if RSI(?) closed at 71, then a short entry was executed on the following open.
A time exit was used, starting with a 2 day exit (which means an exit on the open of the 3rd day) and increasing in increments of 2 with a maximum length of 50.
The minimum RSI period length tested was 2 with a maximum of 15.
The SPY was the first symbol tested, using all history available. Future tests will include more ETFs and stocks.
The test uses 100K of starting equity with gains compounded on each trade.
Results:
Overbought = 70
Overbought = 80
Overbought = 90
Discussion:
Feel free to discuss this amongst yourselves. It is my birthday today, and I have lots of things to do to prepare for the grand Luau.
As time permits today, I will be back to update this post to include some discussion about these results and to draw some conclusions.
I will leave on this thought (If only to stir up some controversy/discussion): it appears that the standard RSI setting of 14 has been almost useless, over the past 16 years, as an overbought indicator. Of course I have tested the most simple application of this indicator and have not measured how it performs when showing a divergence.


Feliz cumpleaños mi amigo y muchas mas.
Thanks ( I think ) Cuervo!
Happy b’day
Happy B-day homes! Have a great one.
I’m crashing the Luau. Have a good one Wood, Jeff
Happy B’day. Enjoy your Luau.
Thanks ya’ll!
Any traders in the Richmond, Va. area are welcome to come. Email me for directions and time.
We have a whole cooked pig being delivered…Lots of beer…
woodshedder_blogspot @ yahoo dot com
Happy birthday Shed! Hot-damn, son, how old are you now, 28? 31? 46? Can you believe that this is the third year we’ve all known each other (you, me, Fly, RC)? Crazy.
Anyway, this white rhino’s for you.
On the topic of this post, I would say that RSI(2) above 70 for 4 day exit is ok, 2 day exit is the best, as inferred by profit.
I think it’s cool how those charts show the other periods as literally “under water”
Finally, I think it’s interesting that using 70 has more edge than 90. Even though 90 and 80 have less blue than the 70. the 70 doesnt work at all, on any period, but then outperforms significantly on a 2 day/4 day exit of RSI(2) – RSI(4).
Is this a correct interpretation?
36 Danny. I can’t believe it has been 3 years. That is crazy.
I think what you are seeing has to do with the increased number of opportunities that accompany the lower break point of 70. As you know, opportunity * expectancy = net profits.
As the break points move from 70, 80, 90, opportunities decrease. I could backtest each of these and then examine the metrics generated in order to really know which one is better. I imagine the drawdowns vary significantly across the three break points. But that is not really the point. The point (I think, need to run more tests) is that an RSI period of more than 5 is useless as an overbought indicator.
Yeah, aren’t those 3-D optimizations cool!
word!
Happy Birthday Woodshedder! Nice charts dood!!
Woody,
Hey, you’re not getting older, you’re getting…
Oh, what’s the use. I’m not gonna bullshit you, man.
You’re getting older. Deal with it.
http://www.someecards.com/upload/birthday_n/lets_over_celebrate.html
Many returns!
Those charts look like a wave study from Gio.
Happy b-day, bud.
Wood,
Richmond eh? MANY years ago I worked for CC. I’ll pass the luau invite on to 34,278 of my recently unemployed degenerate friends.
Have a great birthday.