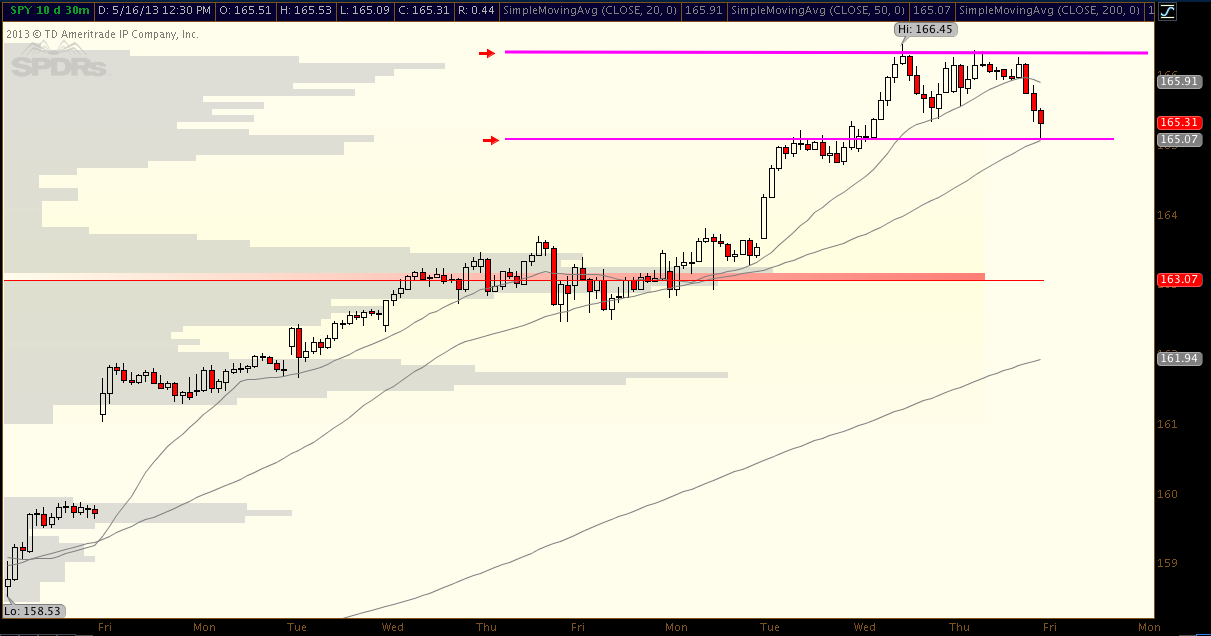
When glancing over the S&P 500 year-to-date chart, one can easily discern the change in the character of the market (aside from the fact that this market seemingly only goes up). The early morning gaps higher and the late day fades have made this v-shaped move extremely hard to play, especially if you are a swing trader. Breakouts from weekly bull flags and other powerful technical set ups have been working for the most part in the hot sectors like the biotechs. However, there is still a vast amount of false moves occurring. A breakout will trigger, then fade and hit stop loss orders, only to press on and rip higher within the next couple of days. With these types of games being played, I decided to experiment with the oversold algorithms in The PPT.
First and foremost, I am not one for indicators. I like to strictly play price action and technical set ups. I do not like to deviate from my technical style too much either, for in the long run (in terms of win percentages and probability) it is key to remain consistent. With that being said, I am always open to applying new filters to my trades to increase my odds at winning. It is necessary to do this because the market character as a whole is constantly changing. If you have a tried and true method as your backbone and are open to apply a tool or analysis to refine the trades that you take, then your system will ultimately be more versatile and successful in the long run. We all want to achieve profits in the long run with our capital, right?
I am not trying to pump The PPT here, but I am just being honest and demonstrating that it is useful for providing that necessary filter discussed above. With each of the algorithms resetting in their respective time frames, it always allows the current dynamics of the market to be integrated into the system. I took some trades this week using my technical style in conjunction with the oversold readings of The PPT (I looked for trades that were hybrid oversold). I deviated from the traditional style through not waiting for a breakout to occur. Now that may have decreased the probability of the trade working, but I leaned on the backtested results of The PPT to carry me through that line of logic. It is hard to say what is more probable at that point. In this analysis, The PPT wins.
So the basis behind these trades is this: find a technical setup that contains a good risk reward ratio, and layer that into the oversold or extreme oversold readings of The PPT. I filtered my selections of the oversold readings by screening for stocks that had greater than 5% return with over 80% accuracy. For those of you who are not familiar with The PPT, it gives timeframes for the stock to make its move. Those timeframes are 1,3,5,7, and 10 days. I did not really pay too much attention to that when using this method. As long as it was greater than 80% accurate for the 3 and 5 day timeframes, I was fine with it. This is where I leaned on the technicals of support and resistance in my traditional analysis.
The results were great. I have detailed several cases below, and I will discuss it further after I run through these examples. I do not want to get caught up in a bunch of writing without some hard evidence.
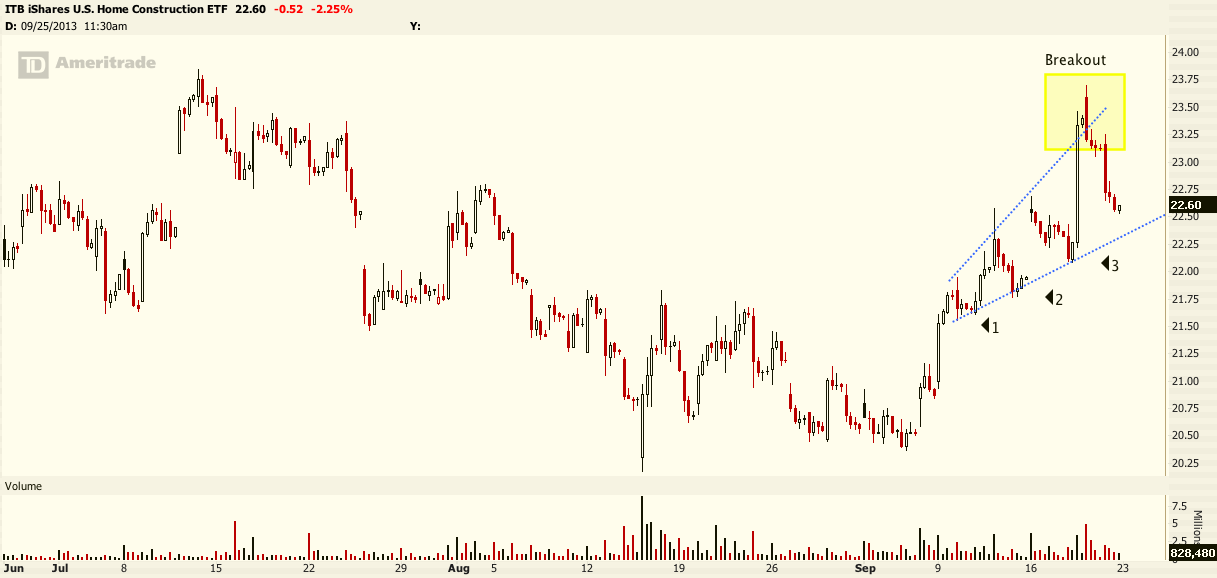
MeetMe, Inc (MEET)
The company is volatile, cheap, and heavily shorted. It has been in a harsh downtrend, but I was able to make a play off of the 30 day, 30 minute chart. The chart is below.
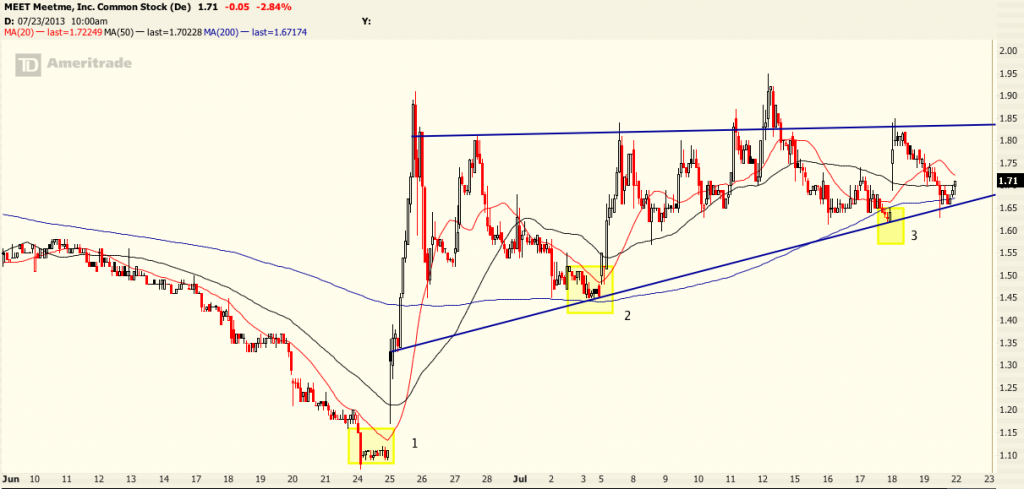
The trade that I took is highlighted and labeled by the number 3. As you can see, I was able to catch a nice 10% move higher the next morning. I highlighted and labeled 1 and 2 because that is where The PPT had previously marked this stock as oversold. Look at those returns. Unfortunately, I did not take those trades because I did not see an emerging ascending triangle pattern of higher lows. After I took my trade, the stock fell back to the trendline and price responded by putting in what looks to be another higher low. The PPT is currently marking this as oversold yet again (hopefully the Fly does not kill me for saying this). Maybe this ascending triangle pattern will be resolved this week through busting the upper range, and press on higher to kill the shorts in the name. I would have remained in stock and let the pattern resolve itself, but a 10% move is hard to not take any gains from.
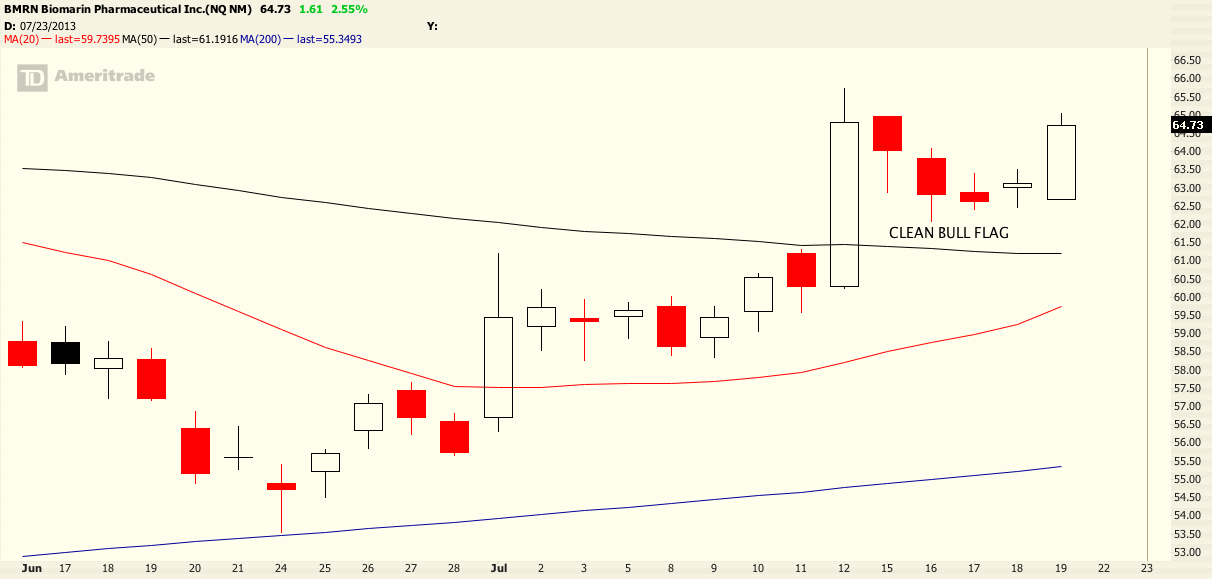
BioMarin Pharmaceuticals (BMRN)
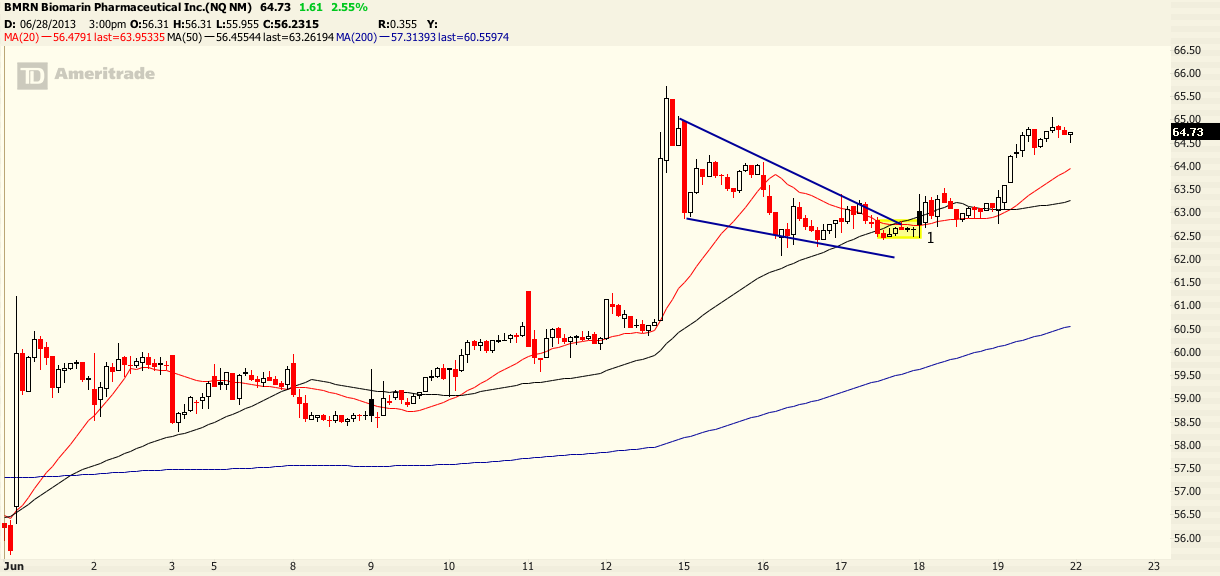
With the biotechs recently taking off, I was pleased to find one that had pulled back a little. The PPT produced an oversold reading at the base of what appeared to be an emerging bull flag pattern. The daily and 30 minute charts are shown below.

From the daily chart, you can see that the stock is in a clear uptrend. I felt better going long in this name than with the previous MEET trade. The clean pullback made me look for an entry point.
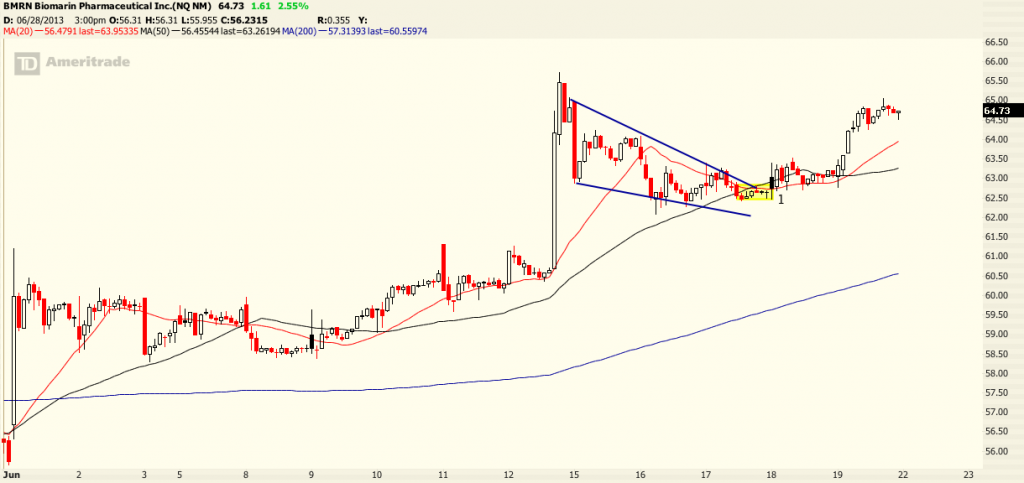
The flag can be better seen from the 30 minute chart in the month of July. The PPT measured an oversold reading in the highlighted area marked with the number 1. That oversold area happened to be at the base of the emerging pattern. The average return for this reading was over 10%. Instead of waiting for the breakout to trigger, I was able to get an early entry. The flag did indeed break higher, and if you were to try to get filled it would have been a little tough as the name trades fairly thin. I would still be long this name, but I had to exit early due to the fact that I was traveling. I think this will trade higher and run up into earnings this upcoming Thursday. It had a very nice hybrid change of over 50% in the last session.
Harman International (HAR)
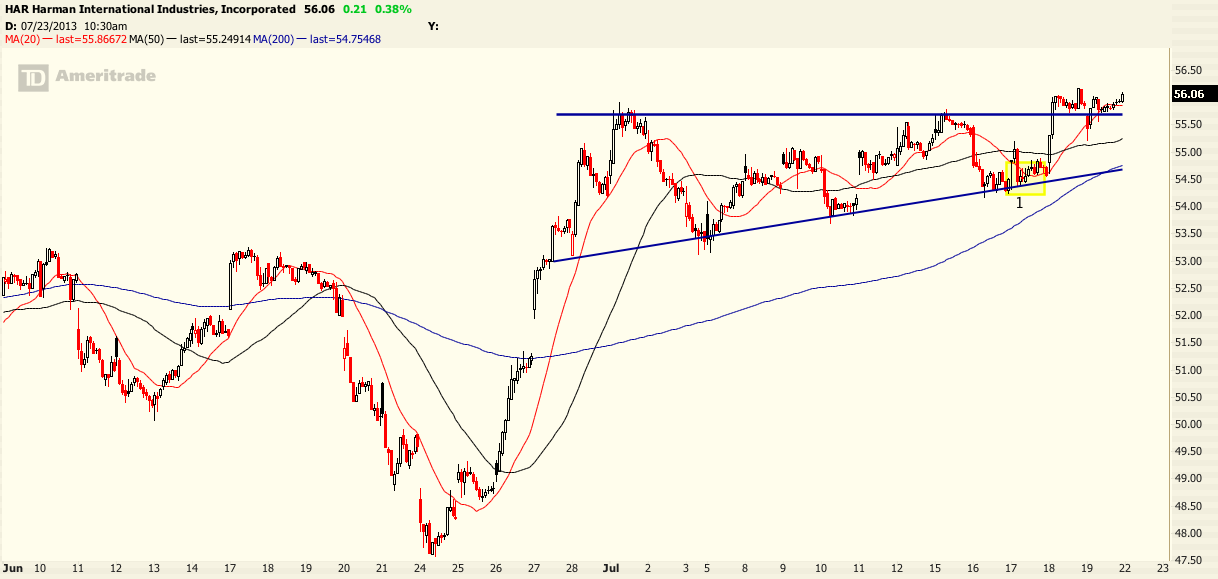
This trade in particular was extremely fun to play. I love stocks that are flagging on their daily time frames while at or near all time highs. Out of all the stocks I have detailed, this is by far the healthiest chart. I was lucky to find an oversold reading in this name. The daily and 30 day, 30 minute charts are below.
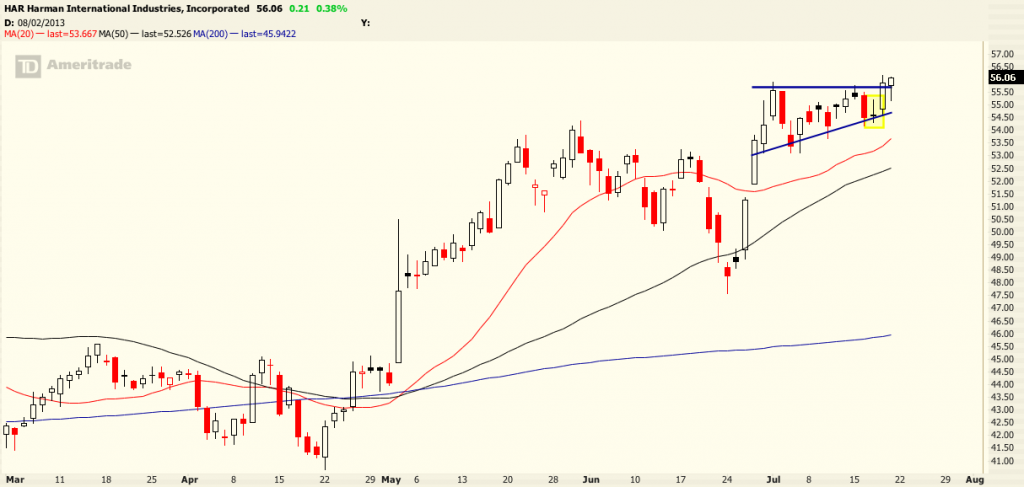
Notice the highlighted daily candle in the flagging pattern (it can also be viewed as ascending triangle I suppose). That was where The PPT had marked this stock as oversold. It was a real cliffhanger of a close, as it pressed right on to the lower trendline in the final moments. It held the previous days low, and The PPT was displaying that it potentially had, on average, a 6-8% move in the works.
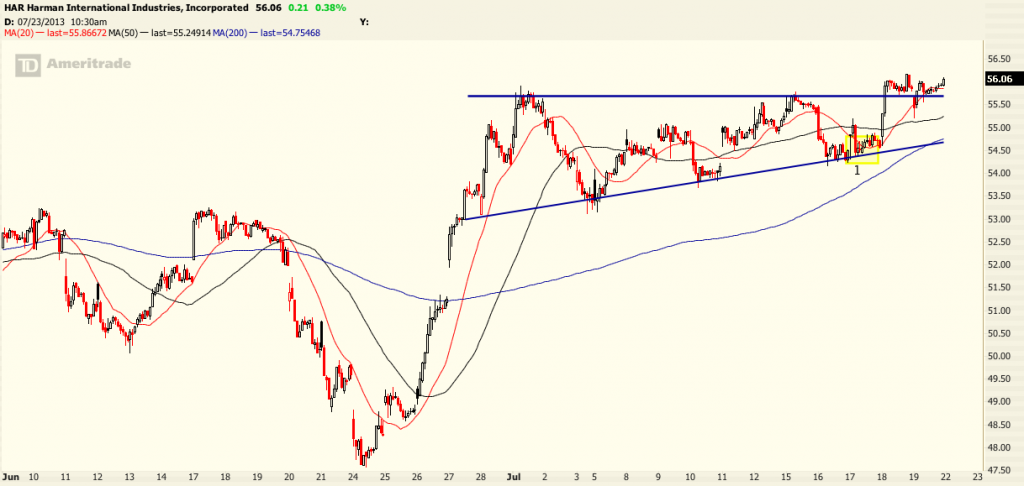
A closer picture of the price action displays the flagging formation in a better light. The highlighted area with the number 1 on the chart depicts where The PPT marked the stock oversold, and this is where I had initiated the trade. As you can see, this is right on the support of the lower trendline. The stock raced higher the next morning, and ended up reaching the traditional breakout entry point. This is where I would typically first scale into the stock. Since I am already long, I can pour on more capital. The weekly chart looks ready to rip higher as well.
Ruckus Wireless (RKUS)
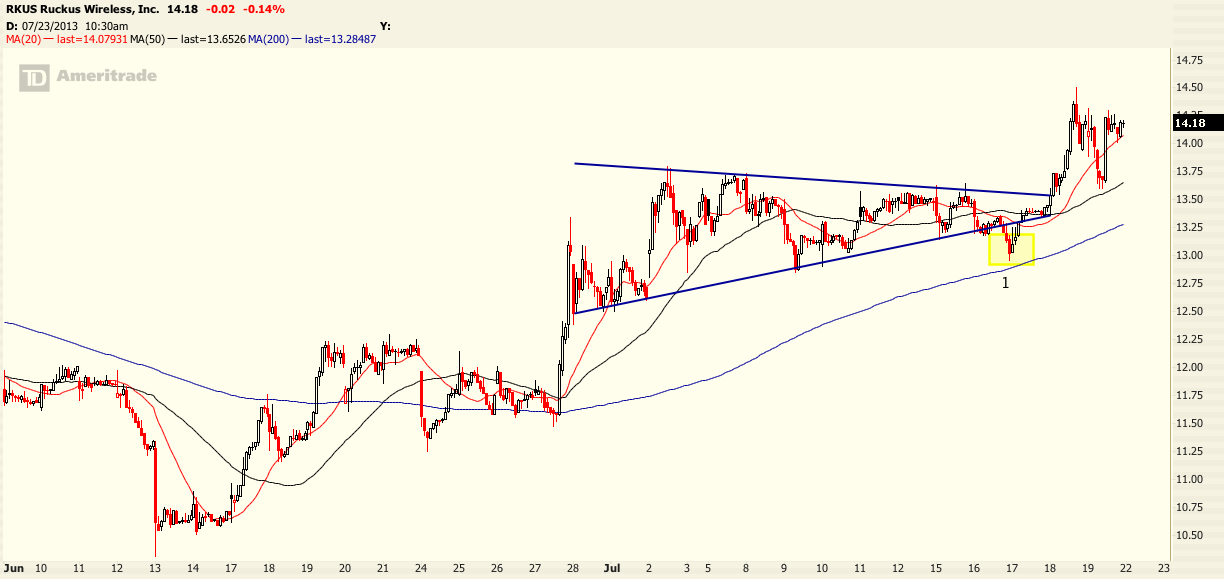
Many of you may have already heard about this from either Option Addict, RaginCajun, or the Fly. It is a hot stock right now and a lot of people are playing this breakout. The daily chart does not show much, so I have just pasted the 30 day, 3o minute chart below.
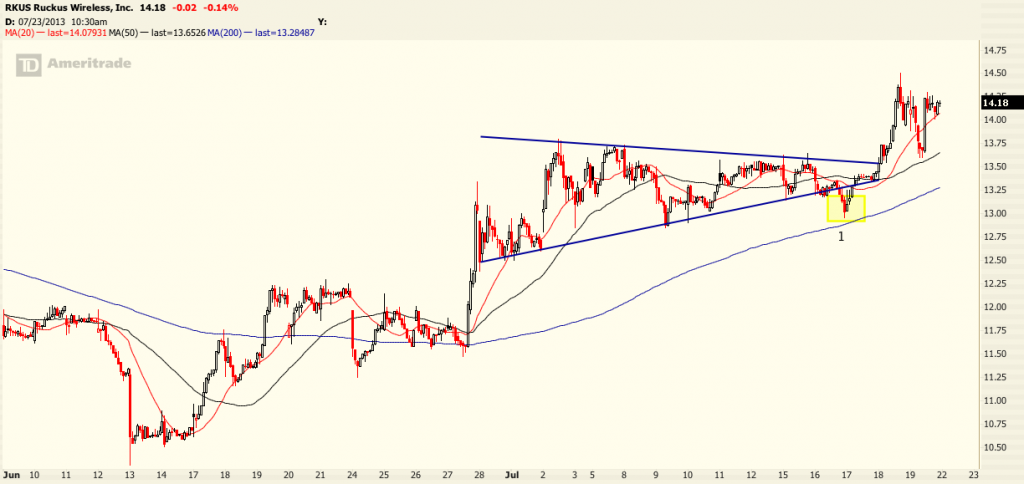
This chart depicts a very interesting case. The symmetrical triangle of lower highs and higher lows had broken lower after probing the highs of upper trendline. The brief slice through this trendline was a traditional entry point, but a late day fade and some harsh selling the next session hit a bunch of stops. The stock failed to breakout. The PPT registered an oversold reading when this occurred. Again, it is represented by the highlighted area marked with the number 1. The move that happened the next two days was incredible. I was playing this trade alongside RaginCajun and other 12631 members. We were originally stopped out, but we had all re-entered at the breakout to make back our loses and more. Many PPT members bought on the oversold reading alone, which gave them an opportunity for quick gains. I think this brings up a great point of discussion. What happens when the technicals of a chart are broken? Where would the entry for a trade occur?
The trades I ran through above all contain one common denominator: emerging chart patterns. Being that the system utilizes oversold readings, the results will always contain some type of “buy the dip” style. When doing this in the context of a pattern, it can be extremely powerful. Having statistical knowledge of how the stock has behaved in the past at oversold levels will allow for greater accuracy. If the trade does work in your favor, then you have a margin of safety and flexibility. Gains can be taken early, or more cash can be applied to the trade at traditional entry points. However, a trade failure with an oversold reading and technical breakdown does present a slight problem. I think a logical stop loss would be the next important or relevant price support. In the RKUS trade, that would have been a break through 12.85.
The oversold and overbought readings can also be particularly useful in day trading as well. In fact, I was able to pull off two great day trades in LL and RAX this week using such readings. The names were on the oversold list with great stats, and I used some technical insight to buy an intraday dip. I will detail this in a different post if you guys are interested.
As you can see, there are a wide array of uses with this oscillator that is embedded in the screener. I will continue to explore it to find more opportunities and filters to apply to my trades. Again, no one at iBankCoin told me to write this. I just found it interesting to apply a tool that has been tailored and backtested to a specific stock. Please feel free to leave ideas, suggestions, or questions in the comments section below!