First and foremost, let me give you a portfolio update. I sold off my RTEC position to raise additional cash. I added an extremely small ODP position in hopes of a short squeeze. My cash levels now stand slightly above 25%.
Does anyone else sense the threat of a bear rally here? Maybe it was just me watching the close of the major indices today, but the sell off was quite harsh. My portfolio was thrown around throughout the session. At one point I was up about 2%, and then everything went to hell in a hand basket. It was led by the late day selling pressure in SLCA and USG.
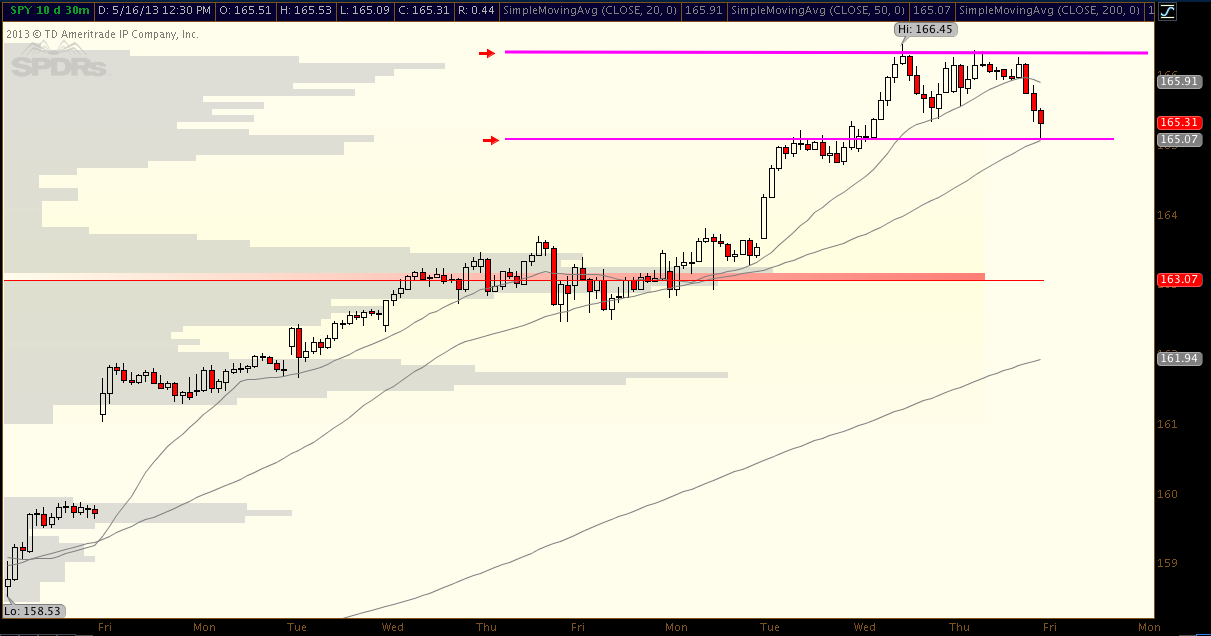
Above is a 30-minute chart of the SPY with a volume profile. The two purple lines represent high volume prices, and the red line represents the highest volume price. We tumbled off the highs and are now riding on the lower volume support. Considering the market at its current stage, this is a critical point. I think there are two scenarios that can play out tomorrow: an inside day, or a further fall to the downside. Should we break the support, we head to 163 in short order. I’m not betting on a top (I am 75% on the long side), rather I believe that there is a pullback in the cards. This is what forced me to cut one of my positions today.


One Response to “Stuck on the Charts”
discover this
Furthermore, i believe that mesothelioma cancer is a extraordinary form of cancer malignancy that is often found in individuals previously familiar with asbestos. Cancerous cellular material form from the mesothelium, which is a protective lining which covers almost all of the body’s internal organs. These cells ordinarily form inside the lining of your lungs, stomach, or the sac that really encircles the heart. Thanks for expressing your ideas.