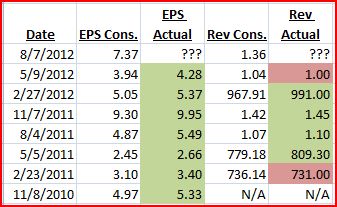
Priceline reports 2/26 AMC. Below is a history of PCLN EPS/Revenue estimates and actual reported numbers. PCLN has a history of beating on EPS and revenues except for a couple misses in 2012 and one in 2011.

Looking at competitors of PCLN that have recently reported can give us some insight on expectations of price action (earnings data from StreetInsider):
- EXPE – EPS (miss) revenue (beat); opened down -1.61% and closed -2.67%
- TRIP – EPS (beat) revenue (beat) ; opened down -9.21% and closed -7.14%
- OWW – EPS (miss) revenue (beat); opened up 0.37% and closed +16.67%
- TZOO – EPS (beat) revenue (beat); opened up 4.11% and closed +24.31%
From a competitor standpoint it was a mix on EPS but all beat on revenue. The opening move seemed fairly mute except for TRIP, which saw buyers and hit highs within the first 30min of trading. PCLN was talked about stock on 8/8 when it saw a big gap down and closed near the lows. In this report it missed on revenues but more importantly it guided down for Q3’12 EPS (to which it ended up beating on Q3 release).
For further explanation of the excel tables and data in them please refer to this post.

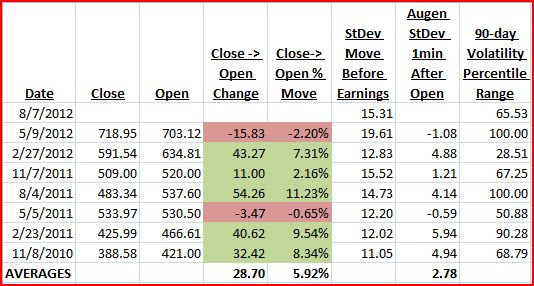
Looking at the Augen StDev 1min After Open average it is showing 3.75. I like to take this multiplied by the current StDev Move Before Earnings which is showing 13.79.
3.75 * 13.79 = 51.71; this is my expected point move based on prior price action and volatility movements into earnings.
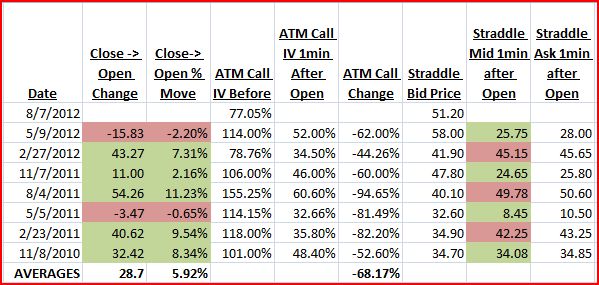
The next table shows implied volatility (IV) moves and looks at the ATM straddle to see what the option market is pricing (I prefer to use the bid for purposes of the worse possible fill). On the far right the green cells represent a win selling the straddle and the red cells represent a loss):

Looking at the data the 2 most recent earnings saw some of the biggest moves on a percentage basis and we are right about where we were back on the 8/7 earnings release in which PCLN saw its biggest move. Some other notes:
- Straddle (going off bid price) is pricing 7.2% move
- ATM Call IV is low comparing to past
- Except for 2 prior earnings the straddle sale has been very profitable and alternated quarters between a win or loss
To me selling volatility doesn’t seem like the better trade here. But I also think that the two prior earnings moves has many with that observation and I like to think when things become too obvious the opposite can happen.
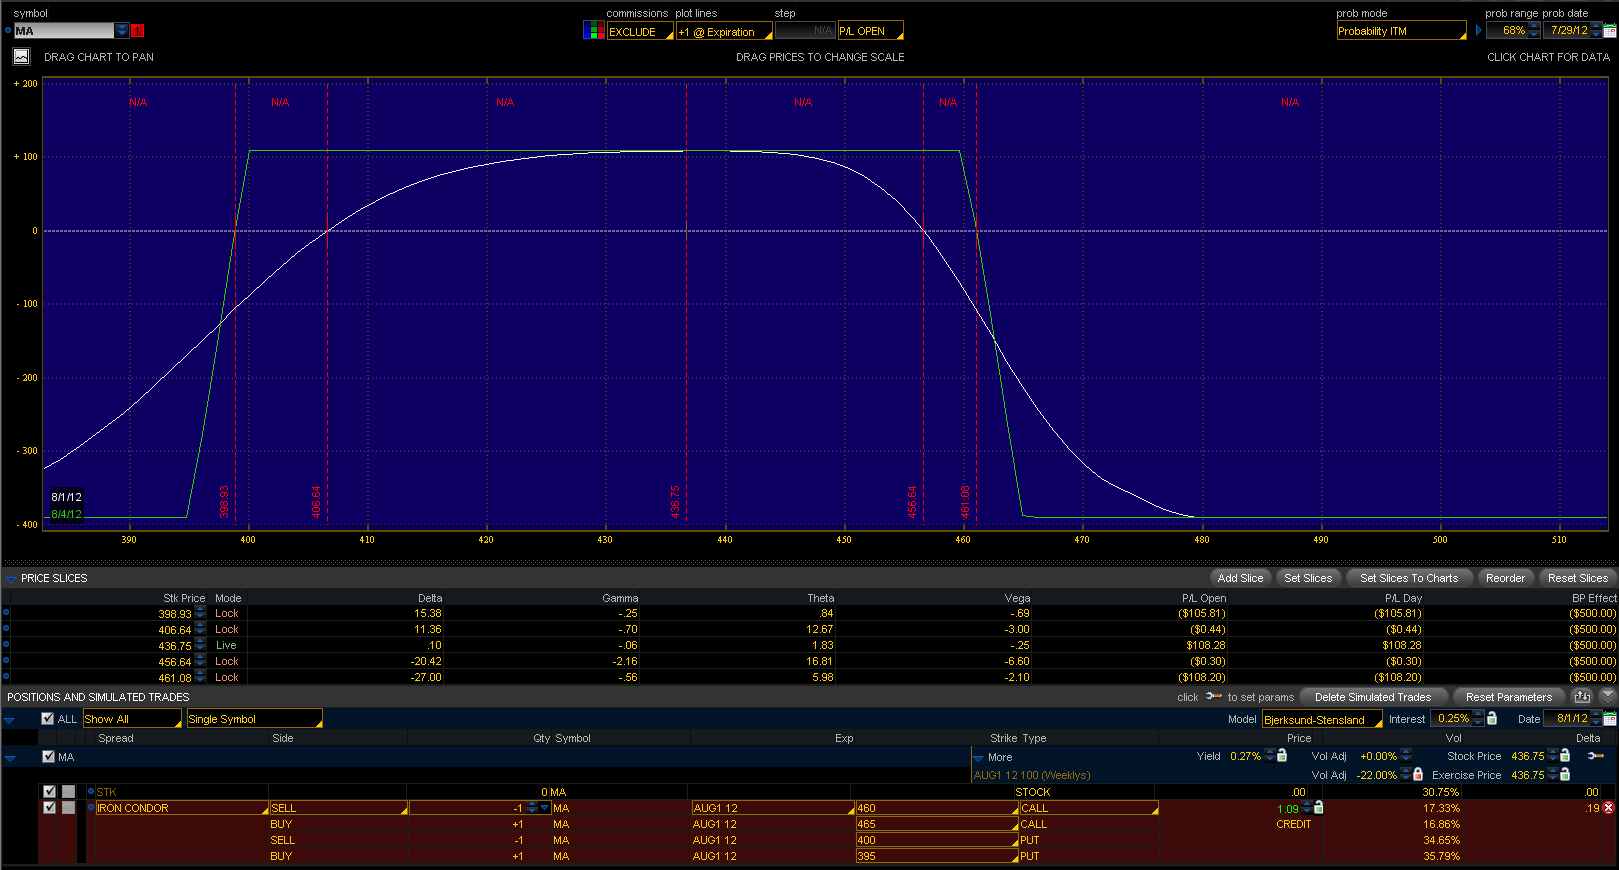
So is volatility a sale? Given the data its a no in my opinion but now that a big move is expected, I believe the opposite will happen. Also the competitors stats have me leaning towards a volatility sale as well, especially when they have had previous big gaps on earnings yet recent release is fairly muted from close to open. I definitely would not sell a straddle unless you can afford a big loss. I personally like selling an Iron Condor (managed risk vs straddle sale).
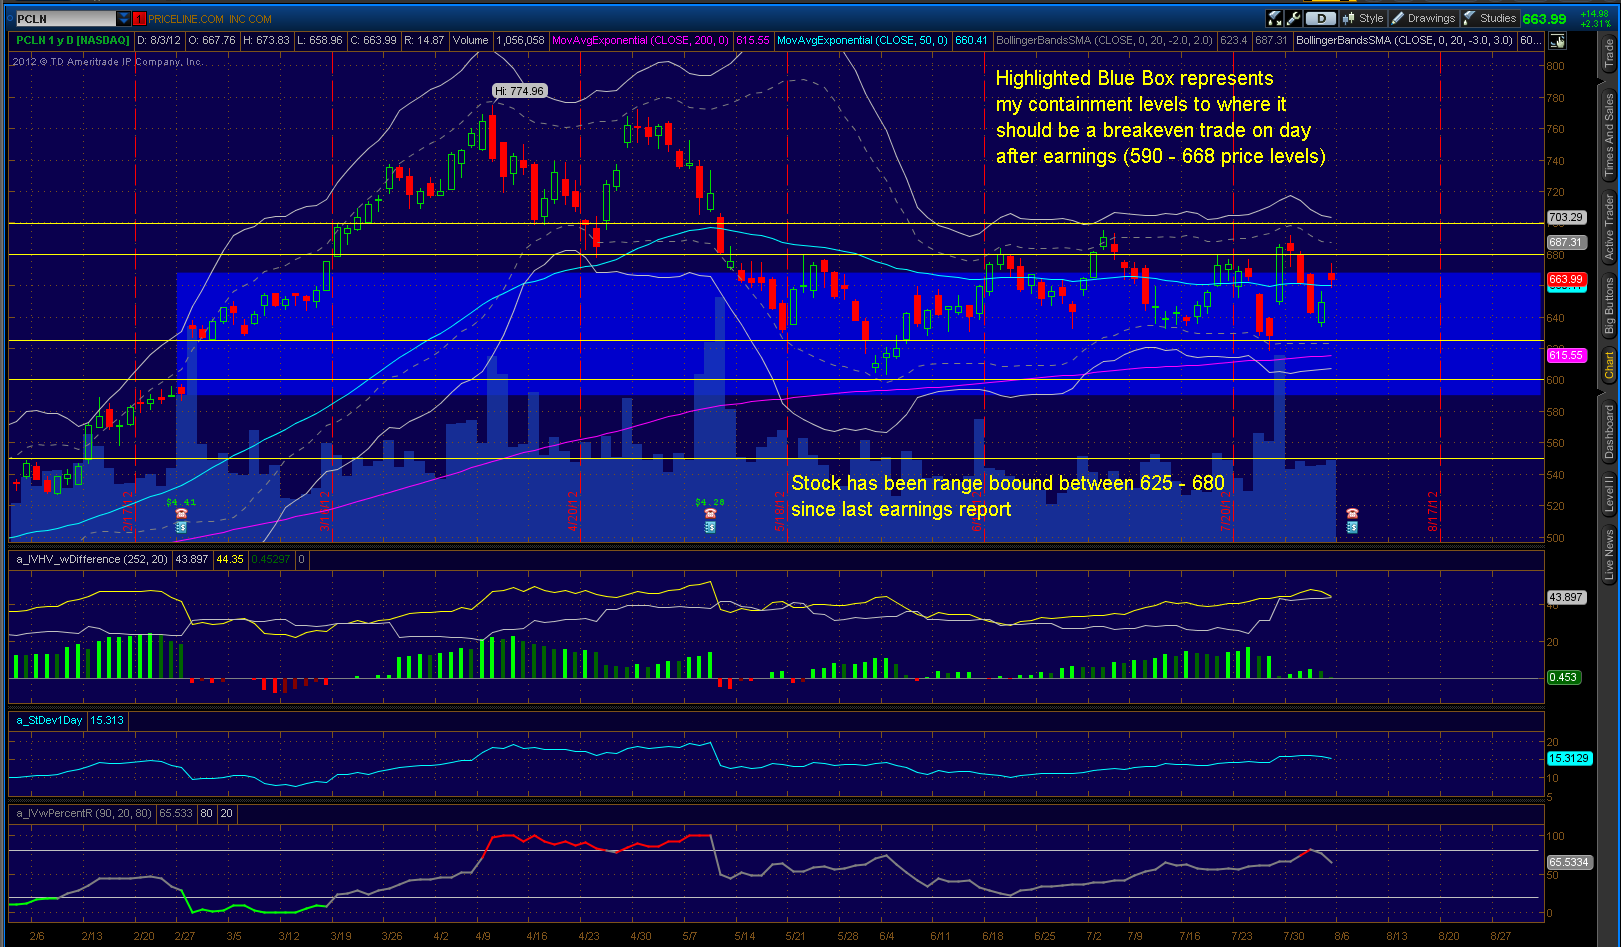
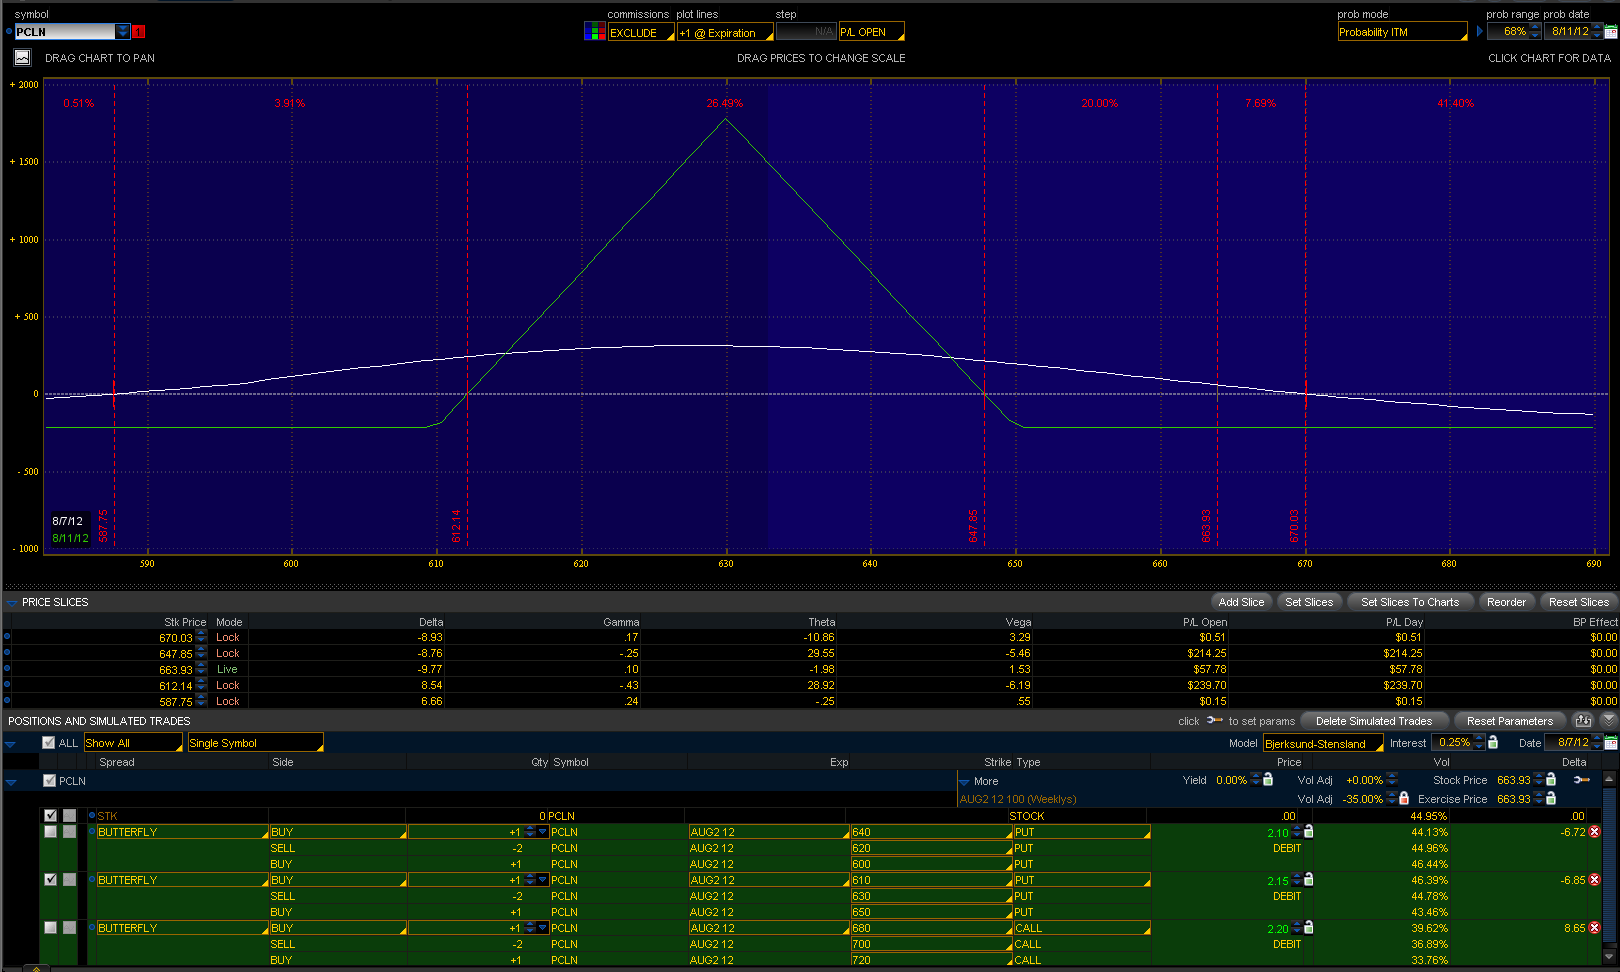
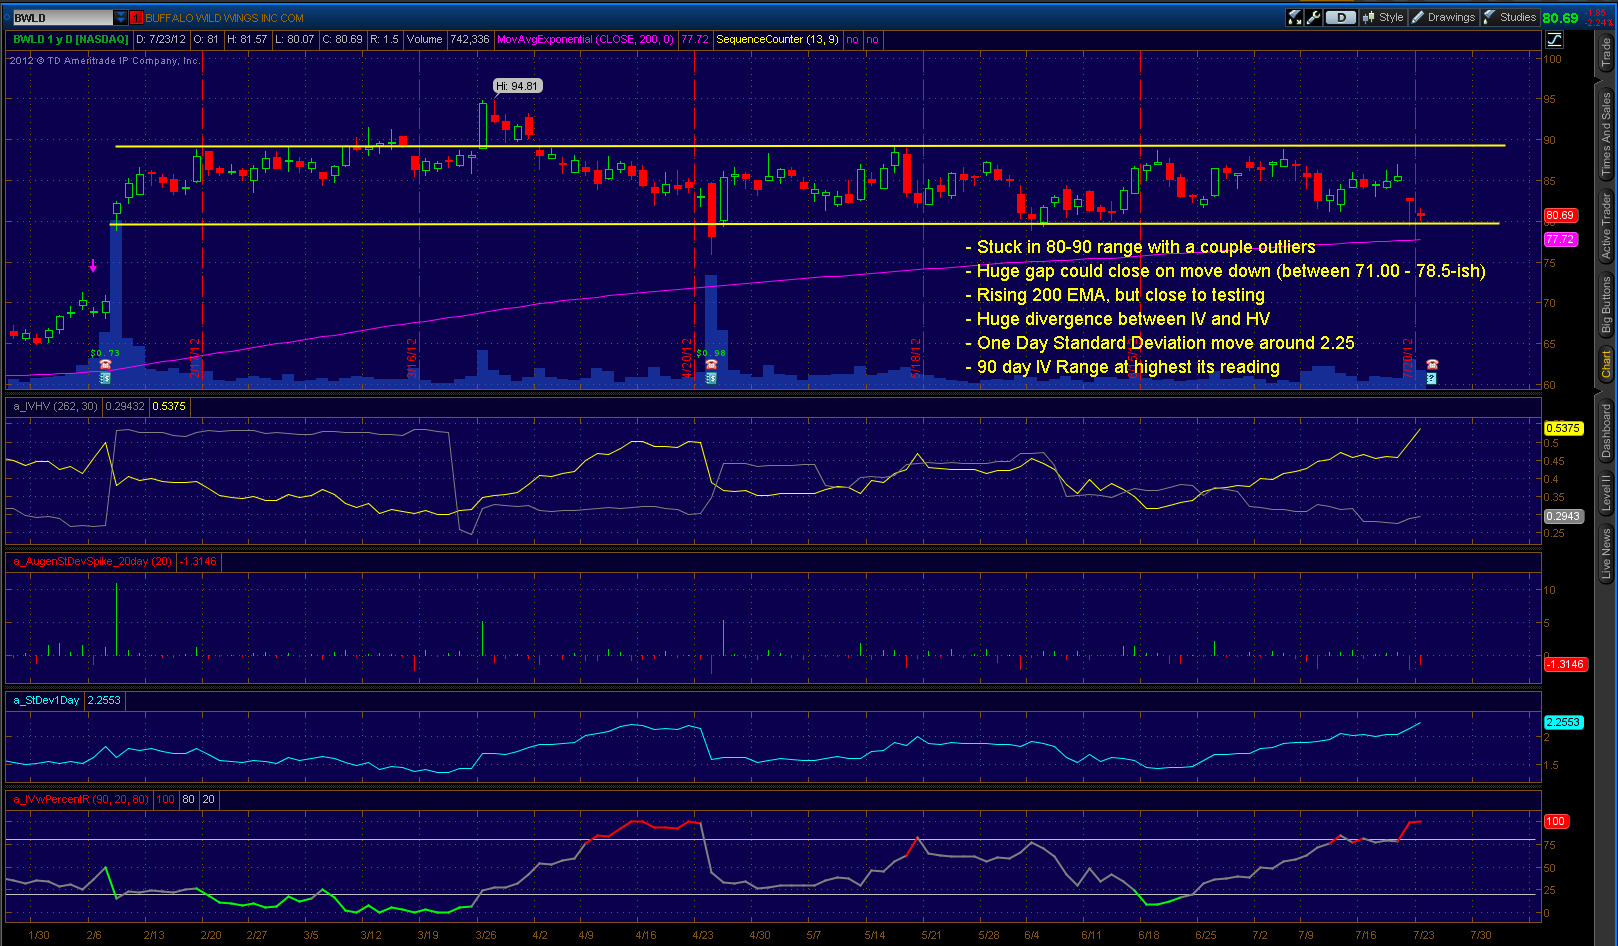
Looking at the chart (notes on chart):

The chart above has yellow dashed lines showing where I want PCLN to stay within into Friday expiration. The trade I like:
Sell March1 620/625/735/740 Iron Condor for 1.92 credit, risk $308.
Below is the risk profile with red dashed lines representing a 10% move. In this trade I make a profit (at Friday expiration) if PCLN stays within -7.2% to the downside and +9.7% to the upside (all going off EOD data 2/25/2013):

Also you could come in on those strikes for a lower risk, lower probability trade. I like this trade as I am looking for volatility to be a sale and look for the price to stay contained. If I price action goes against my thoughts/expectations then this trade will probably be a loser. Personally I trade and would recommend trading earnings accepting a 100% loss as earnings trades are a gamble in where all you can control is your risk.