Last I night I wrote a post titled Oversold In An Oversold Sector that listed stocks that were oversold in the Basic Materials sector. This post was written after reading The Fly’s post and how the proprietary PPT algo was flagging XLB as oversold. The performance results of this ETF were attractive based on prior results when it flagged oversold.
In my post I listed stocks that were being flagged as oversold within the Basic Materials sector. With the generous approval from The Fly I will list specific stock results of top performing stocks based on those results within The PPT. The total list contained 25 stocks of 250 being flagged as oversold. All results/returns are listed on a 10 day holding period of the stock.
The first list contains stocks that have a greater than 4% return when flagged oversold, sorted by average return:
An example on how to read the data: No. 1 stock CLF has flagged as technically oversold 9 times within the past year and has shown a positive return 78% of those times with the average 10 day return being 9.06%.
| No. | Ticker | Price | Avg % Return | % Times Up | # Times Flagged |
| 1 | CLF | 48.01 | 9.06 | 78 | 9 |
| 2 | HLX | 16.88 | 7.89 | 78 | 9 |
| 3 | OII | 48.88 | 7.72 | 80 | 10 |
| 4 | RRC | 60.8 | 7.64 | 78 | 9 |
| 5 | OXY | 85.25 | 5.55 | 80 | 10 |
| 6 | CLB | 113.75 | 5.47 | 90 | 10 |
| 7 | BRY | 39.84 | 5.41 | 73 | 11 |
| 8 | CXO | 84.34 | 5.26 | 80 | 10 |
| 9 | STR | 21.07 | 5.13 | 89 | 9 |
| 10 | STO | 23.25 | 4.87 | 80 | 10 |
| 11 | CDE | 16.94 | 4.82 | 75 | 8 |
| 12 | GPOR | 19.43 | 4.49 | 73 | 11 |
| 13 | ETE | 40.73 | 4.48 | 80 | 10 |
| 14 | GG | 37.77 | 4.37 | 86 | 7 |
| 15 | DO | 58.88 | 4.33 | 75 | 8 |
| 16 | CVX | 105.07 | 4.2 | 83 | 12 |
The second list contains stocks that have shown a positive return over 80% of the time when flagged as oversold:
| No. | Ticker | Price | Avg % Return | % Times Up | # Times Flagged |
| 1 | XOM | 84.8 | 3.8 | 90 | 10 |
| 2 | CLB | 113.75 | 5.47 | 90 | 10 |
| 3 | STR | 21.07 | 5.13 | 89 | 9 |
| 4 | GOLD | 91.21 | 2.52 | 88 | 8 |
| 5 | GG | 37.77 | 4.37 | 86 | 7 |
| 6 | EMN | 50.14 | 3.56 | 83 | 6 |
| 7 | CVX | 105.07 | 4.2 | 83 | 12 |
| 8 | CXO | 84.34 | 5.26 | 80 | 10 |
| 9 | OII | 48.88 | 7.72 | 80 | 10 |
| 10 | VALE | 19.92 | 2.18 | 80 | 10 |
| 11 | ETE | 40.73 | 4.48 | 80 | 10 |
| 12 | STO | 23.25 | 4.87 | 80 | 10 |
| 13 | OXY | 85.25 | 5.55 | 80 | 10 |
This table can be read much in the same as the previous table with the only difference is this one has some different stocks because these are positive 80% or more of the time.
What I do like about the results are that they have more than a couple data points with the minimum being 6 and the most being 9,10,11. When you combine these stats along with the charts and other information (ie, short interest, options order flow, etc.) it can set up for a higher probability trade. Some of my favorites are listed below. Apologies for the crude annotations as I’m using StockCharts on a free account as I have no access to my charting software.
1) OII – nice breakout and good volume on the breakout; 10 day hold 80% chance positive with average return 7.72%

2) RRC – breakout above recent swing high with volume, like the volume pattern as its basing, still within uptrending channel; 10 day hold 78% chance positive with average return 7.64%

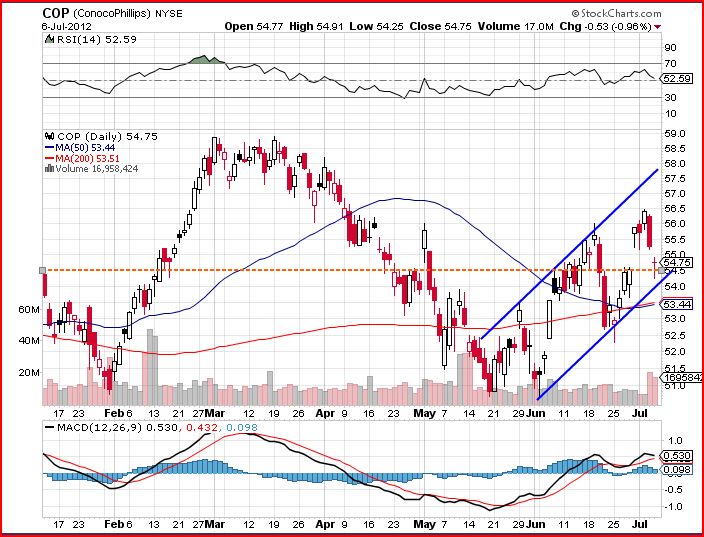
3) COP – at the bottom within an uptrending channel with a reversal candle, hanging on to support level; 10 day hold 73% chance positive with average return 3.80%
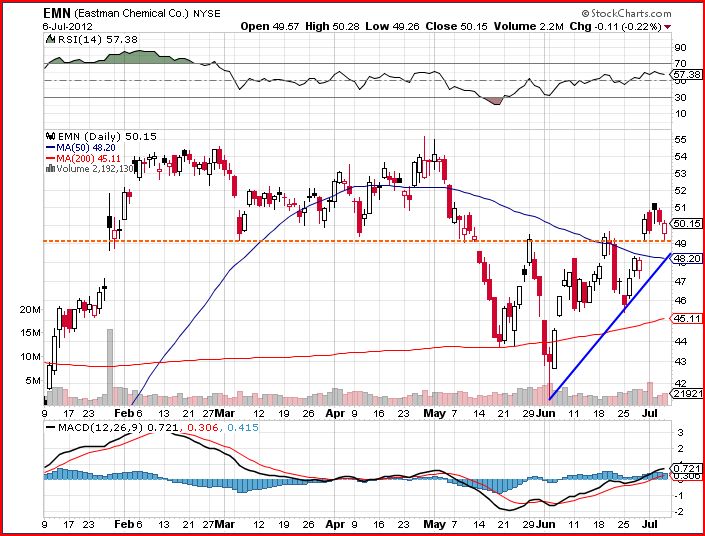
4) EMN – holding gap support from February at 49 level; 10 day hold 83% chance positive with average return 3.56%
Hopefully the charts can give a clearer picture of the price action. One reason why I picked these charts is that they are displaying positive short term trends and are flagging as oversold within those trends. Here is the list again of all charts provided by FinViz.


2 Responses to “Oversold Stocks In An Oversold Sector (Updated)”
Woodshedder
Great post!
redman59
appreciate the comment woodshedder, fine tool that PPT is