Charts Posted – Fri 2/8

305 views

Below is a list of charts with notes I posted to the stream (chronological order) during market hours on Friday 2/8 (except for INTU & JCI posted pre-market).  You can also see these on my profile at Chartpin.

1) INTU – at an important level, looks vulnerable, lagging RS & lg selling volume, earnings Feb 21 AMC

intu_0208

2) JCI – weakening industry/mkt performer, hit on earnings, closes below lows of >Avg volume up days on >Avg volume

jci_0208

3) GES –  big gap above 28, inverse H&S pattern, >14% short float

ges_0208

4) MCD – like the reaction/volume as it came back & tested 94 y’day, moving >y’days high today

mcd_0208

5) PPO – nice high volume bounce off 200sma, earnings 2/20 AMC, 30.8% short float w/30.6 days to coverppo_0208

6) MCRS – like the volume pattern and prior 2 days action w/today confirming

mcrs_0208

7) DLX – nice volume pattern off earnings w/follow thru, low volume pullback to 10ema

dlx_0208

8) VCI – hitting 52 wk highs & 27% short float w/28 days to cover

vci_0208

9) PKD – nice b/o of range here

pkd_0208

10) UNFI –  liking todays move w/intraday volume supporting b/o’s; recently broke long-term TL

unfi_0208

Charts 1/15/2013 – EEM, NTRS, FET, GPI, KNX, NFP

623 views

Here are some charts are I put out last night.  My goal here is to chart some more of the quiet stocks that don’t get much attention on the social stream.  There is one exception and that is the ETF of the iShares Emerging Markets (EEM).  The chart looks great and what you want to see in a risk-on environment.  Below you will find the symbol with FinViz link and the notes that were put out with the chart:

1) EEM – like the flagging action here, like to see this in the risk markets

eem_20130115

2) NTRS – regional financial, like the volume on this move up w/low volume pullback, earnings soon

ntrs_20130115

3) FET – oil & gas name trading cheap xFwd #’s, holding & like the CwH retest here on recent downgrade

fet_20130115

4) GPI – like the FA value w/10.3 days to cover, y’day action favorable on high volume w/follow thru today

gpi_20130115

5) KNX – broke the down TL on >avg volume, basing below resistance/200sma w/earnings coming

knx_20130115

6) NFP – insurance broker, like the pattern w/17 & 50sma support, 12+ days to cover

nfp_20130115

Hybrid Movers with Volume Score – 01/07/2013 (ALR, INFA, MAPP)

933 views

Below are some hybrid movers with volume as shown within The PPT.  For previous explanation refer to this prior post.

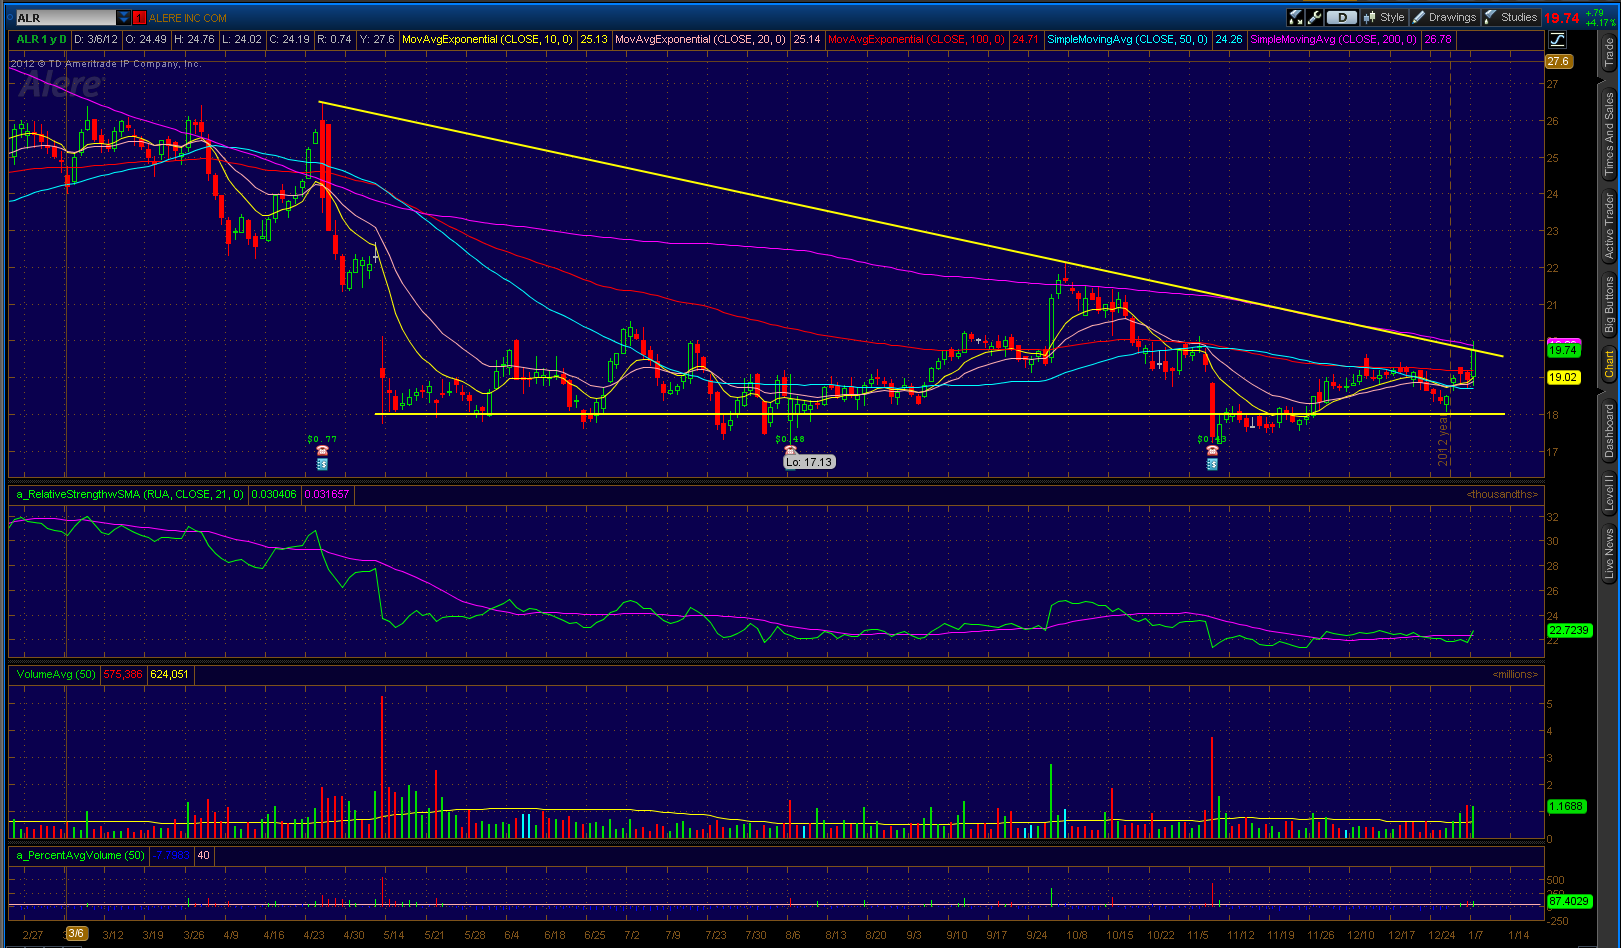
1) ALR – descending triangle w/move to descending 200sma on 87% volume >50 day avg; would look for 10% move >20


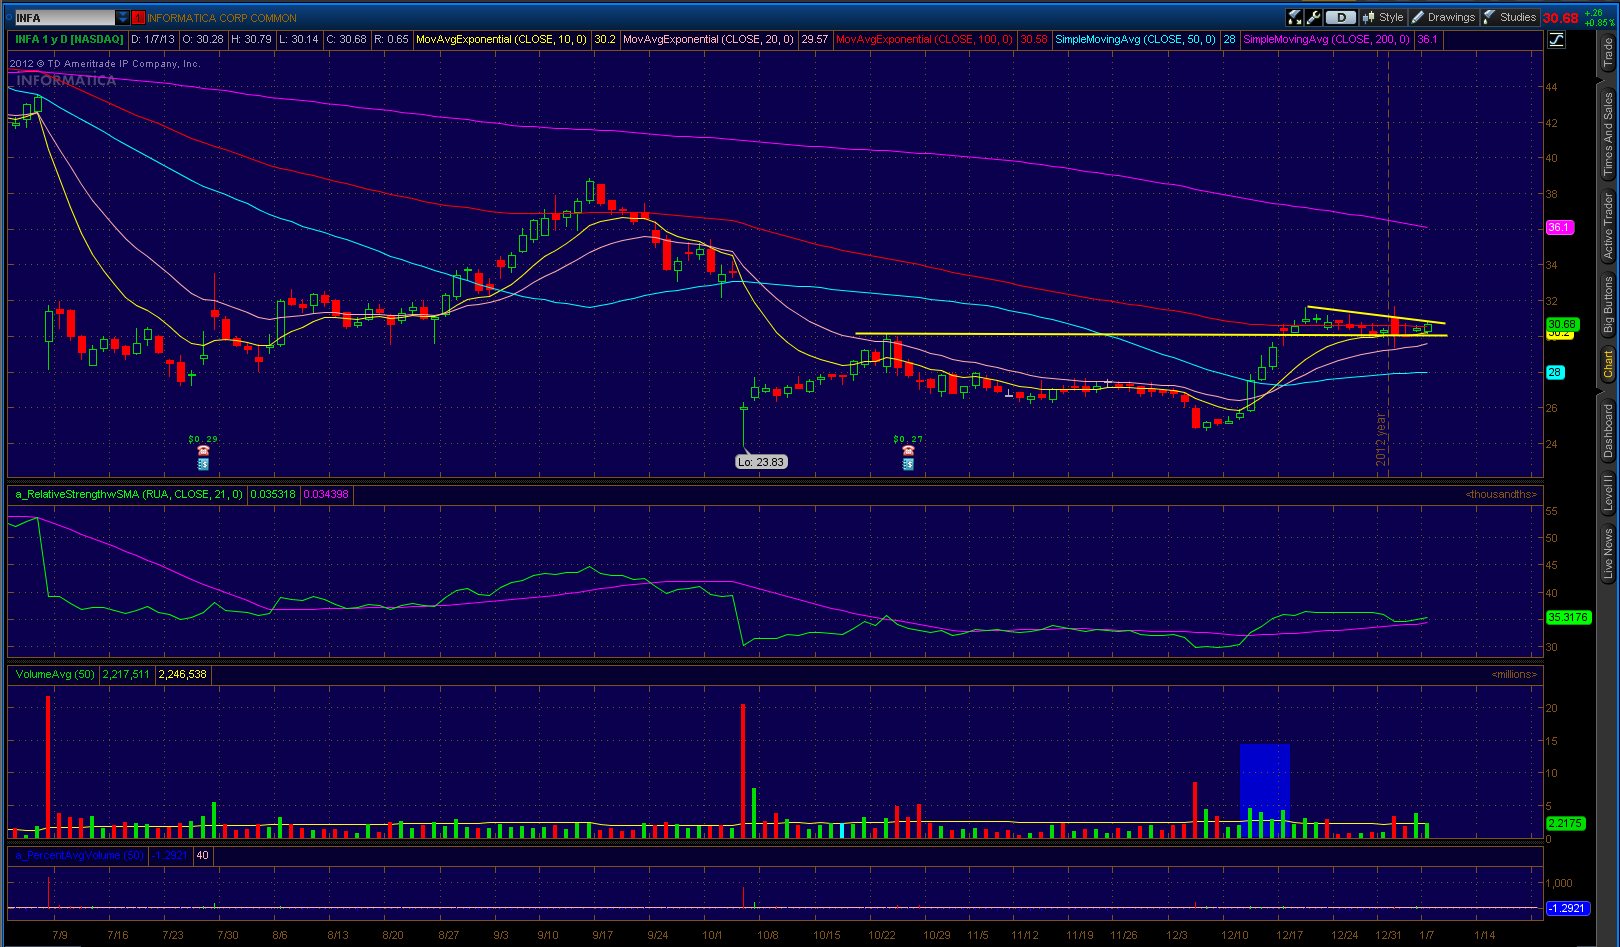
2) INFA – a stock w/big gaps, volume 73% >Avg y’day as it came near 30-level & tightly coiled


3) MAPP – don’t play much in drug stocks but this one at a big level w/16.5% short float 21.7 days to cover

Charts Posted – Fri 2/8

305 views

Below is a list of charts with notes I posted to the stream (chronological order) during market hours on Friday 2/8 (except for INTU & JCI posted pre-market).  You can also see these on my profile at Chartpin.

1) INTU – at an important level, looks vulnerable, lagging RS & lg selling volume, earnings Feb 21 AMC

intu_0208

2) JCI – weakening industry/mkt performer, hit on earnings, closes below lows of >Avg volume up days on >Avg volume

jci_0208

3) GES –  big gap above 28, inverse H&S pattern, >14% short float

ges_0208

4) MCD – like the reaction/volume as it came back & tested 94 y’day, moving >y’days high today

mcd_0208

5) PPO – nice high volume bounce off 200sma, earnings 2/20 AMC, 30.8% short float w/30.6 days to coverppo_0208

6) MCRS – like the volume pattern and prior 2 days action w/today confirming

mcrs_0208

7) DLX – nice volume pattern off earnings w/follow thru, low volume pullback to 10ema

dlx_0208

8) VCI – hitting 52 wk highs & 27% short float w/28 days to cover

vci_0208

9) PKD – nice b/o of range here

pkd_0208

10) UNFI –  liking todays move w/intraday volume supporting b/o’s; recently broke long-term TL

unfi_0208

Charts 1/15/2013 – EEM, NTRS, FET, GPI, KNX, NFP

623 views

Here are some charts are I put out last night.  My goal here is to chart some more of the quiet stocks that don’t get much attention on the social stream.  There is one exception and that is the ETF of the iShares Emerging Markets (EEM).  The chart looks great and what you want to see in a risk-on environment.  Below you will find the symbol with FinViz link and the notes that were put out with the chart:

1) EEM – like the flagging action here, like to see this in the risk markets

eem_20130115

2) NTRS – regional financial, like the volume on this move up w/low volume pullback, earnings soon

ntrs_20130115

3) FET – oil & gas name trading cheap xFwd #’s, holding & like the CwH retest here on recent downgrade

fet_20130115

4) GPI – like the FA value w/10.3 days to cover, y’day action favorable on high volume w/follow thru today

gpi_20130115

5) KNX – broke the down TL on >avg volume, basing below resistance/200sma w/earnings coming

knx_20130115

6) NFP – insurance broker, like the pattern w/17 & 50sma support, 12+ days to cover

nfp_20130115

Hybrid Movers with Volume Score – 01/07/2013 (ALR, INFA, MAPP)

933 views

Below are some hybrid movers with volume as shown within The PPT.  For previous explanation refer to this prior post.

1) ALR – descending triangle w/move to descending 200sma on 87% volume >50 day avg; would look for 10% move >20


2) INFA – a stock w/big gaps, volume 73% >Avg y’day as it came near 30-level & tightly coiled


3) MAPP – don’t play much in drug stocks but this one at a big level w/16.5% short float 21.7 days to cover

Previous Posts by redman59