The
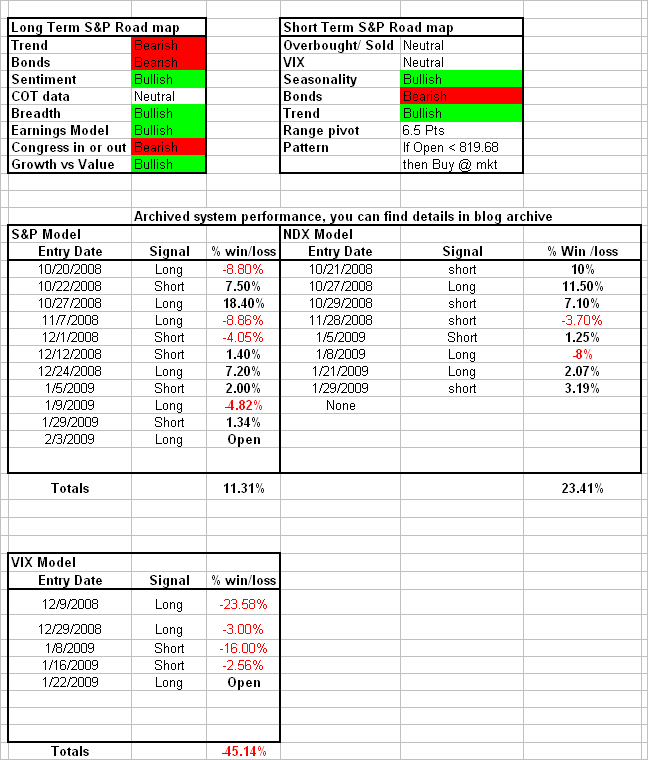
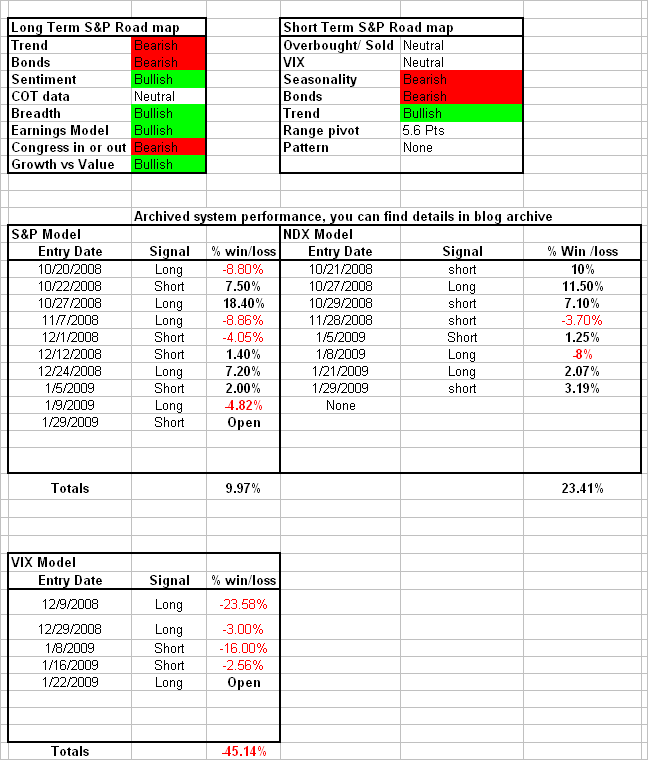
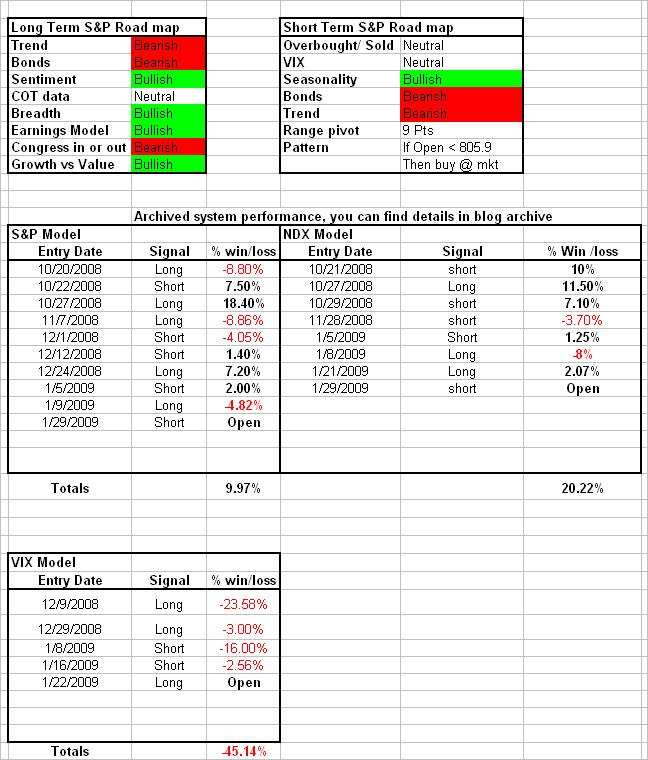
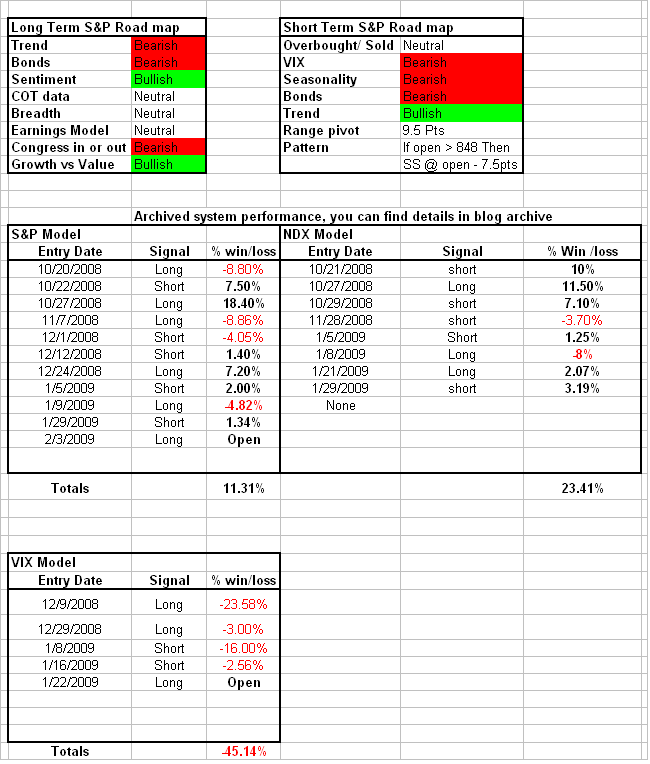
S&P Model is long as of the close of February 3rd. This model will sell the long and get short tomorrow February 6th if the VIX stays greater than 42.32
The NASDAQ model is flat and in cash. No open orders.
The
VIX Model is long as of the close on January 22nd. No open orders.
The road map imagebelowshows the current long and short term influences on the S&P and real time out of sample performance results on the models mentioned above, for a longer term model performance history click on the links above.
 Here is a list of stocks that meet the breakout trade setup criteria of a 10 day Bollinger band width in the bottom decile for a 200 day look back. (CTSH,FMCN,HANS,INFY,INTU,
LEAP,RIMM,TEVA) The next step is to look for a big gap tomorrow (greater than 1 range above or below the close) then enter on a bull or bear range pivot in the same direction as the gap.The real time 2008 performance results are here
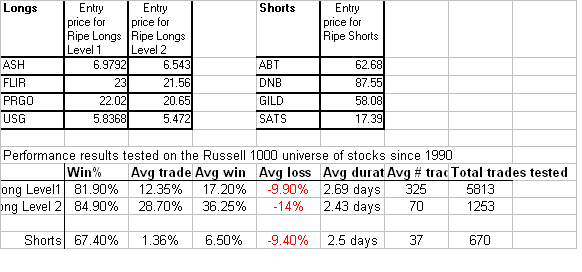
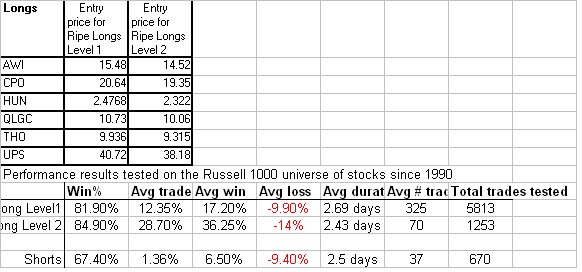
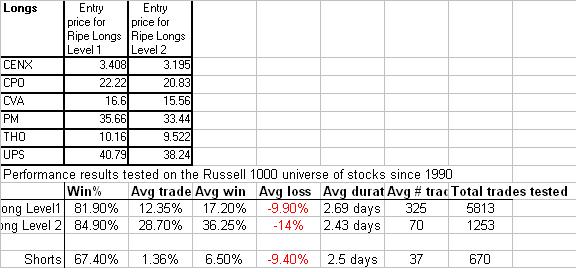
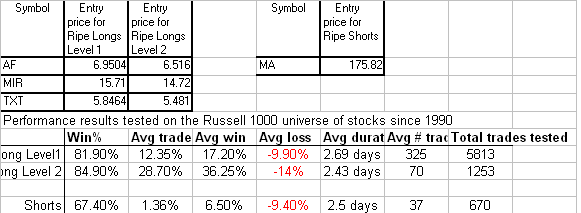
Below you will find a list of long and short candidates. Historically these long and short setups have performed quite nicely when using the entry levels specified next to the ticker and the exit rules below. Here is the real time out of sample performance review of the Ripe Trade results for the year 2008. These are the stocks that qualify for Friday with the entry price limits specified , good for the day only.
Long Exit rules – Exit at the close on the day when a 2 day RSI close is greater than 50 or exit on the first profitable open with a 1 day delay. The 1st profitable open with 1 day delay dictates that I hold the position for at least 2 trading days which includes the entry day then exit on the 1st open that is greater than my entry price.
Short Exit rules – Exit at the close on the day when a 2 day RSI close is less than 70 or exit on the 1st profitable close with a 1 day delay. The 1st profitable close with 1 day delay dictates that I hold the position for at least 2 trading days which includes the entry day then exit on the 1st close that is less than my entry price.
These setups don’t have a stop loss, our research has showed through back testing that this strategy works best without a stop loss. A few ways to limit the risk without a stop loss are 1) Position Size – lowering your position size lessens risk. 2) Watch out for single sector exposure, don’t let one single sector become too big a percentage of your account. 3) Consider using options for blowout protection. For longs consider buying way out of the money puts and for shorts consider buying way out of the money calls. This will create a catastrophe stop that protects you even if the stock has an extreme overnight gap.These setups are for education and entertainment purposes only this is not a recommendation or solicitation. Any action that you take as a result of information, analysis, or advertisement on this site is ultimately your responsibility. Consult your investment adviser before making any investment decisions.
Comments »