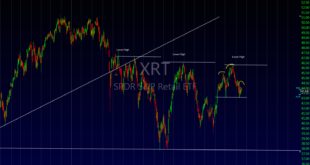
This Week’s Price Action
Weekly Summary:
- Pre-Br-exit panic continues.
- Very little super compelling price action as it appears the markets are in a trading range
First and foremost, Happy Father’s Day to all the Father’s out there.
Market was weak but choppy this week as the players prepare for Brexit and had to deal with the ever annoying Fed, who continues to do nothing and say nothing as they leave people more confused after each meeting. Part of the reason the price action has been so choppy requiring very tactical trading as there is no trend to follow.
S&P:
Swing Time Frame (30 min) : In order to turn the tables bullish, we would need to clear this band of resistance. Otherwise looks like a lower swing high being set here in a swing down trend. We don’t have a clean pattern to work from but with markets in a trading range, appears a 2040 test is likely. Other indexes will back up this thesis.
I know many (including myself) are looking at the potential of this inverse H&S. Two reasons, I am skeptical.
1) The amount of price memory in the left shoulder creation. (typically it will peak and roll over) this was all the gamblers loading the boat into the fed. Suggesting underwater buyers there that need to be capitulated first.
2) The other indexes are suggesting otherwise.
It can happen, but for me to like it, I need to see the fed high taken out, not just the down trend.
Big Picture:
Looks like another trading range being developed. Over the last month we have had a failed breakdown and a failed breakout creating another 100 point box. Within a larger 300 point box (1850 to 2130).
The break of the box and follow though will be the big trade so be prepared for that most importantly.
DJIA
Swing Time Frame (30 min) :
DJIA, it continues to be the easiest of the indexes to read in my opinion. This looks like a H&S top targeting 17313. I will look to be short as long as this is below 17700 with a target of 17313.
Big Picture:
However, let’s keep the big picture in mind as well. We are just making another large annoying trading range. Until we break above or below with conviction and follow through, we must trade it like a range. That is look to be a buyer near or just below the bottom of the range (or on a failed breakdown), and a seller as we approach the top. Then we use the lower time frames to find price action that confirms or denies the thesis. This 800 point range will eventually break one way or another for good and we will trade in the direction, but until then we must expect very choppy range bound trading with many little scalp trade setups and failed moves. Use this chart below to study what you want to look for in a confirmed range break.
Russell:
Swing Time Frame (30 min) : H&S Top targeting 111.36
Big Picture:
Last week we talked about 115 being important. We are now back below 115 on a weekly close which basically confirms a failed breakout. We have the 61.8 fib at 112 (measured move target 111.36)
and then below that support is at 108.
NASDAQ
Swing Time Frame (30 min) : Not much to like here at all. Pretty much the worst of the indexes and has been. Very nice downward channel, would need to see a higher low above the channel to change the picture. Looks like filling those two lower gaps is on the radar.
Big Picture:
Potential double top or H&S top forming. Expect that lower support to be tested at some point in the near future. Based on swing time frame, no reason to think otherwise at this point.
Breadth
Basically unchanged, but weakening overall.
The Bottom Line:
The weight of the evidence is suggesting some further weakness ahead. However we are still are seeing trading ranges that must be broken first and foremost to be overly bearish. Until then we will trade the swing targets (noted above) and look to potentially flip long down near the bottom of the range. A pattern will eventually form to take us out of the range either up or down so we will continue to watch for that. These ranges have tended to last 3-6 months so this can continue for a while still. All we can do is continue to monitor the price action and ignore the noise. Brexit has nothing to do with how I am trading. I could care less. It is the reaction to Brexit that will be important. Gun to my head, it will be a buy the news event, so will be very well prepared by looking for an inverse H&S setup near the bottom of these ranges. If they do exit, the ranges can break and we will use the size of the range as our target. That is all you need to know or care about to be prepared for this event. Don’t spend your time thinking about what it means, nobody knows what will actually happen if they stay or go. However the market will have a trade setup to take advantage of. We want to be aligned with the move whichever way it goes. To sum it up, price action will determine how I am positioned (Long, Short or Cash into and around the event) not what any moron pundit economist (aka astrologist or palm reader) is saying on CNBC. $STUDY.
This Week’s Chart’s in Focus:
Let’s review a few charts that I consider worthy of your attention:
Utilities (XLU): Continue to hold above the cup/handle breakout. As log as it stays above, this continues to be a very good chart to own. Risk is well defined.
XLY : Consumer Discrectionary
Doesn’t look all that healthy, so if you are looking for shorts, inside this sector is a good place to start. A lower high on the longer term time frame (pink), with a small H&S top in the right shoulder (yellow). This sector is on the verge of a late bull market breakdown.
XLI: Industrials
Forming another potential double top. Another sector that looks vulnerable over the longer term.
GDX->A few of you asked me about these this week. This has a cup/handle pattern in motion with a target of 30.10, so continues to be fine.
All of the charts and commentary below are provided as information only and do not constitute a trade recommendation nor investment or trading advice. Any investments, trades, and/or speculations made in light of the ideas, opinions, and/or forecasts, expressed or implied herein, are committed at your own risk, financial or otherwise
If you enjoy the content at iBankCoin, please follow us on Twitter


Hat Tip. Well Done.
Nice charts and view of price action. No vix study?
I don’t typically use VIX to trade because the patterns just don’t seem to work well in my opinion. There is more going on with VIX than just regular price action.
… Something weird. I saw them chasing Brandon. Then they all rolled down a hill. Chloe landed on zoey and zoey landed on Brandon. Then I was hiding behind a tree. I heard Brandon say &#;#108I&28227;m so happy Nikki isn’t here.” that boys is seriously getting a talk to!